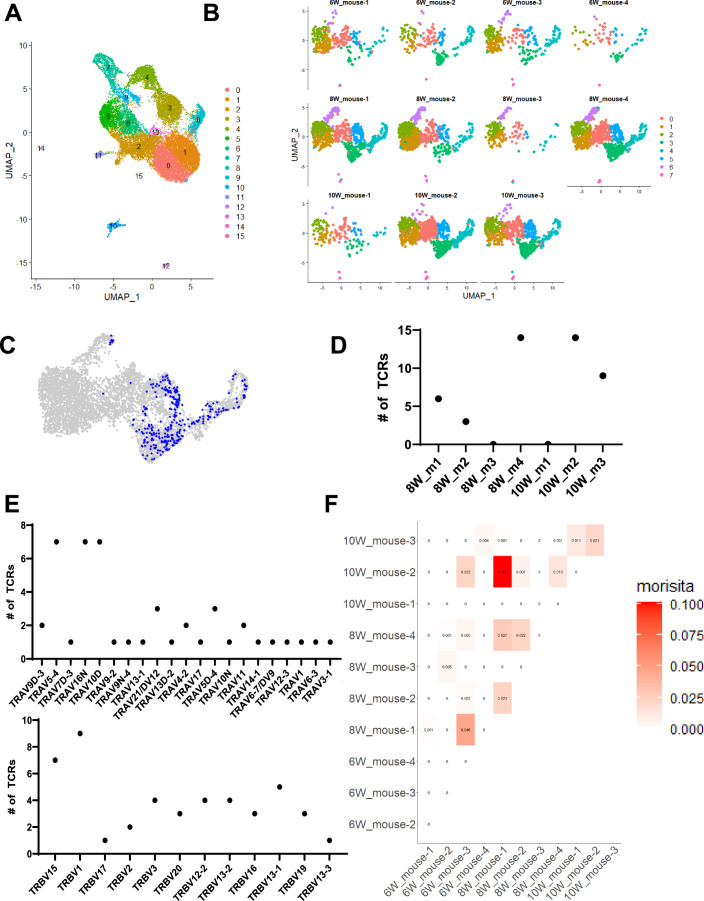
Extended Data Fig. 5. Single-cell RNA-Sequencing of islet-infiltrating CD4+ T cells from NOD mice.
A. Hierarchical clustering of total T cells across 11 mice from 6-, 8-, and 10-week-old time points. B. Hierarchical clustering of CD4+ T cells from individual mice across 6-, 8-, and 10-week time points. C. Projection of top 40 expanded CD4+ T cell clones from 8-, and 10-week-old NOD mice onto Seurat clusters using scRepertoire. D. Distribution of top 40 expanded CD4+ TCR sequences across all mice. E. TRAV (top) and TRBV (bottom) usage from top 40 expanded CD4+ TCR sequences across all mice. F. Morisita-Horn index comparing expanded TCR clones across each mouse individually.

