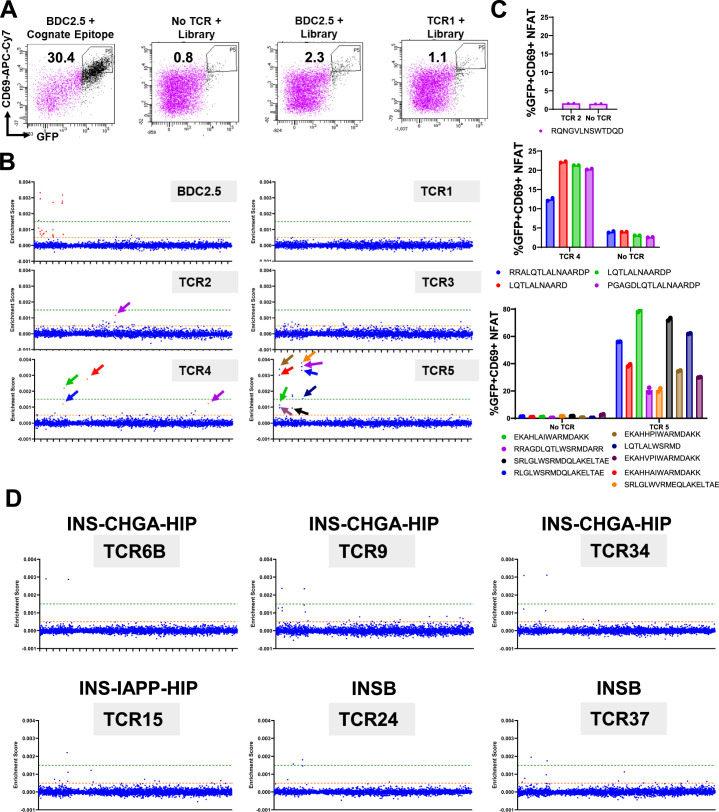
Extended Data Fig. 6. Representative SABR-II screens and hit validation.
A. Representative flow sort gating for cell trace violet labeled NFAT-GFP-Jurkat cells expressing the I-Ag7-SABR-II library after co-incubation with Jurkat cells expressing TCRs. Top 1–2% of cells expressing GFP and CD69 were sorted as is shown in the two rightmost panels (gate is constant across panels). B. ES plots from a single sort of 6-TCRs individually. High and low confidence thresholds are denoted by green and orange lines respectively. The colored arrows indicate putative hits tested for validation with single SABR-II assays depicted in panel C. C. Single SABR-II co-incubations for validation of putative hits from the screens in panel B where single SABR-II expressing NFAT-GFP-Jurkat cells were co-incubated against Jurkats expressing the TCR of interest and assayed 18–20 hr later by flow cytometry. Bars indicate means from 2 technical replicates (dots). Top panel depicts non-validated epitope, middle and bottom depict validated synthetic altered peptide ligands (APLs) and physiological epitopes. D. ES plots for TCRs screened against the I-Ag7-SABR-II library that yielded high-confidence putative hits grouped by the highest non-APL epitope. The same high and low confidence thresholds are used from plots generated in Extended Data Fig. 4.

