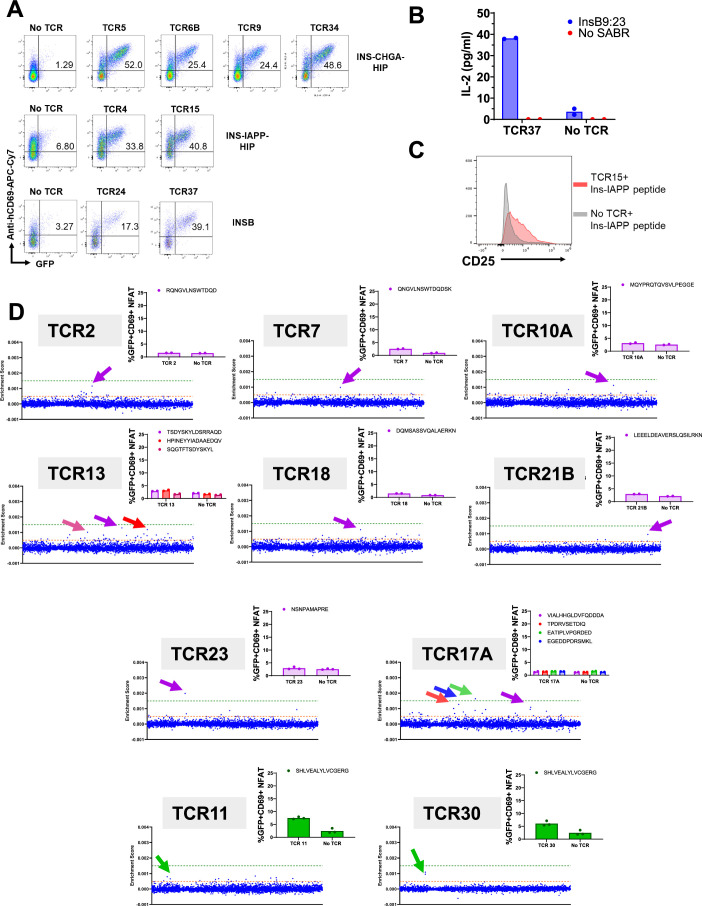
Extended Data Fig. 7. Putative hit validation for high and low confidence hits.
A. Representative flow plots from the single SABR-II validations of the putative hits for high-confidence, non-APL hits. B. Murine IL-2 ELISA from 24 hr co-incubation of 5KC cells expressing TCR37 with NFAT-GFP-Jurkat cells expressing the InsB9:23 epitope where bars represent mean of IL-2 sectretion into supernatant from two technical duplicates (dots). C. CD25 expression measured on primary murine CD4+ T cells expressing TCR15 after 24 hr co-incubation with Bone Marrow Dendritic Cells pulsed with either 1μg InsC-IAPP peptide (LQTLALNAARDP) or no peptide. D. ES plots with arrows denoting epitopes tested in the corresponding single SABR-II co-incubations. The same high and low confidence thresholds are taken from Extended Data Fig. 4. The inset plots show single SABR-II validation assays where bars indicate the mean from 2–3 technical replicates (dots). The arrow colors match the epitopes within each inset plot.

