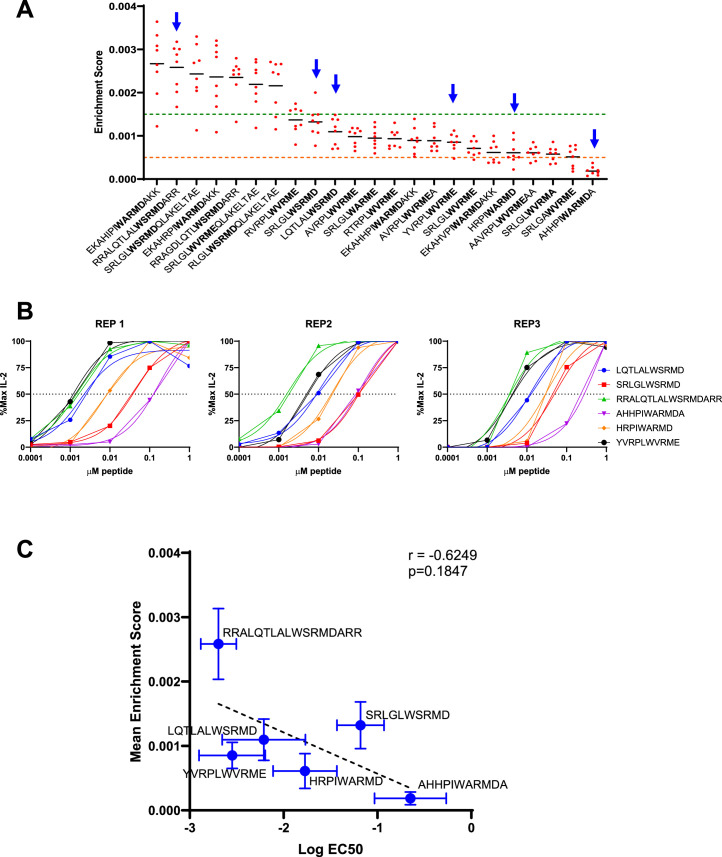
Extended Data Fig. 9. SABR-II screens are semi-quantitative readouts of functional avidity.
A. Selected BDC2.5 epitopes for functional avidity measurements. As shown by blue arrows, 6 epitopes across range of ES were chosen from mean ES (bars) across 8 independent experiments (dots). B. Individual biological replicates of peptide pulsing experiments with BDC2.5 TCR-expressing 5KCs against selected peptides. The y-axis shows normalized murine IL-2 secretion across a range of peptide concentrations (x-axis). C. The mean (dots) and s.d. (error bars) of Log EC50 values (x-axis) from the 3 biological replicates in panel B plotted against the mean (dots) and s.d. of ES values across 8 biological replicates (y-axis). The r and p values for two-sided Pearson correlation (dashed line) are reported.

