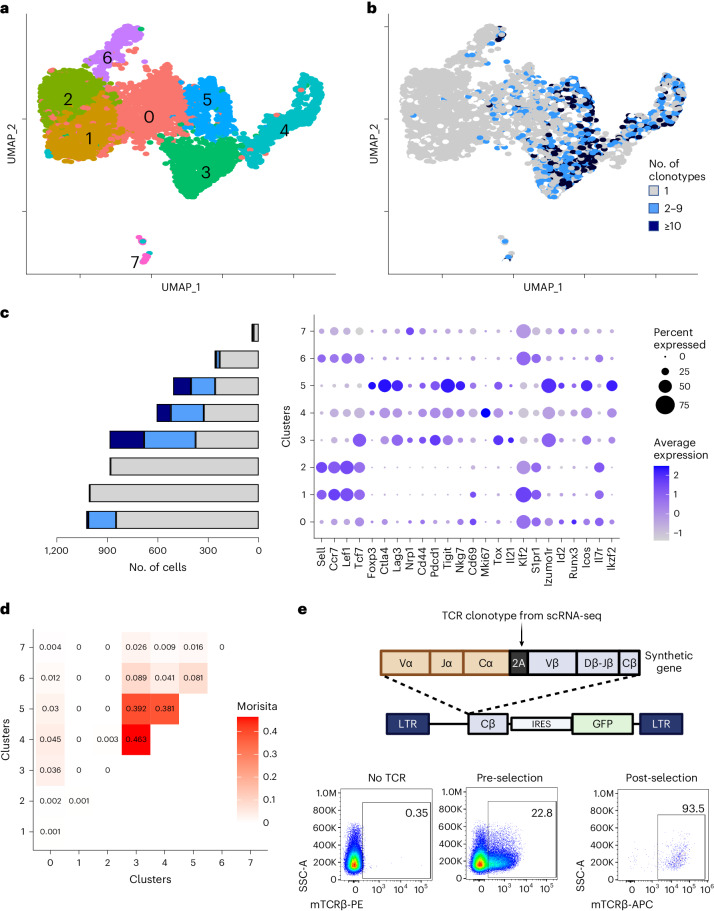
Fig. 2. Single-cell RNA sequencing of islet-infiltrating CD4+ T cells.
a, Uniform Manifold Approximation and Projection (UMAP) representations of islet-infiltrating CD4+ T cells from 6-, 8- and 10-week-old NOD mice. Hierarchical clusters generated by Seurat are shown in different colors and numbered. b, Overlay of clonal expansion on the gene expression cluster UMAP plot. Gray dots represent cells with unique clonotypes, light blue dots represent low (2–9 clonotypes) expansion, dark blue dots represent high (≥10 clonotypes) expansion. c. Dot plot of expression of select T cell markers by cluster. Left bar graph depicts cell number on x axis with colors to denote clone size from b and differential gene expression of select genes across clusters. d, Morisita–Horn index plot comparing all TCR sequences across each cluster. e, Schematic (top) of TCR cloning strategy into pMIG-II backbone along with representative flow cytometry plots (bottom) of murine TCR levels before and after enrichment in Jurkat cells.

