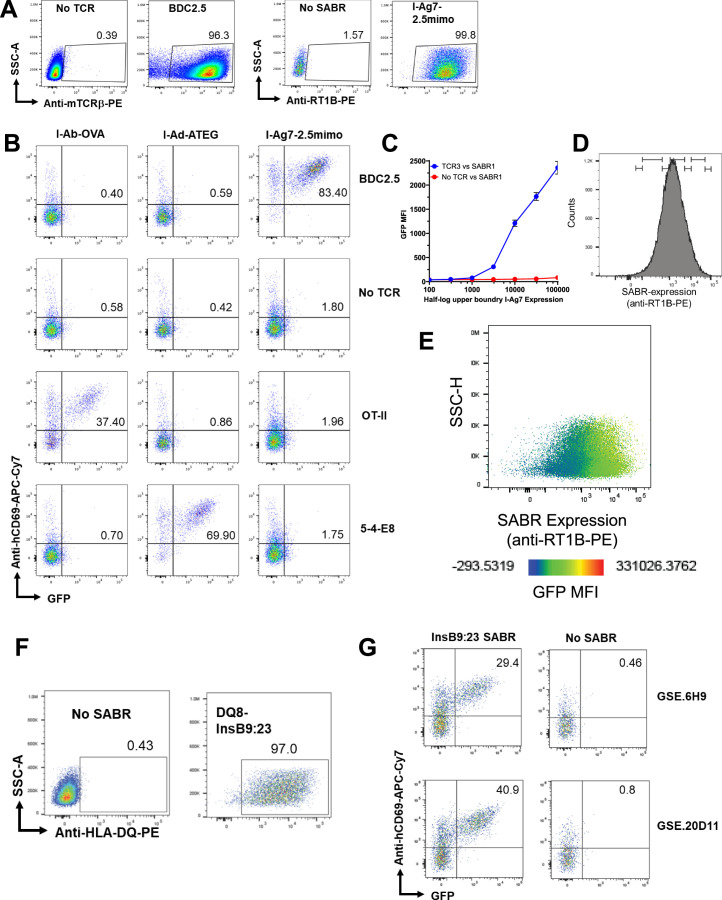
Extended Data Fig. 1. SABR expression and signaling.
A. Representative expression of murine TCRβ (Bdc2.5 TCR) and I-Ag7-2.5mimo SABR-II after transduction of Jurkat and NFAT-GFP-Jurkat cells respectively. B. Representative flow cytometry plots of SABR-II expressing NFAT-GFP-Jurkat cells after co-incubation with TCR-expressing Jurkats. The TCRs and SABRs are indicated by rows and column names respectively. C. TCR3 expressing or mock Jurkats were co-incubated against NFAT-GFP-Jurkats cells expressing the I-Ag7 SABR presenting the QVEQLELNAARDPN HIP (SABR1). The GFP MFI was plotted (y-axis) as dots with s.d. (error bars) from technical duplicates against the I-Ag7 levels binned by half logs of the I-Ag7 labeling MFI (x-axis, bins depicted in D). D. Gating strategy to generate the half log bins of I-Ag7 expression in panel C E. Representative pseudo color dot plot depicting the I-Ag7 levels (x-axis) of SABR1 NFAT-GFP-Jurkats co-incubated against TCR3 expressing Jurkats depicted in panel A. The pseudo coloring depicts the GFP MFI for each given event. F. Representative expression of the HLA-DQ8 SABR-II after transduction of NFAT-GFP-Jurkat cells. G. Representative flow cytometry plots of SABR-II expressing NFAT-GFP Jurkat cells after co-incubation with TCR-expressing Jurkats. The respective TCRs and SABRs are indicated by rows and columns respectively.

