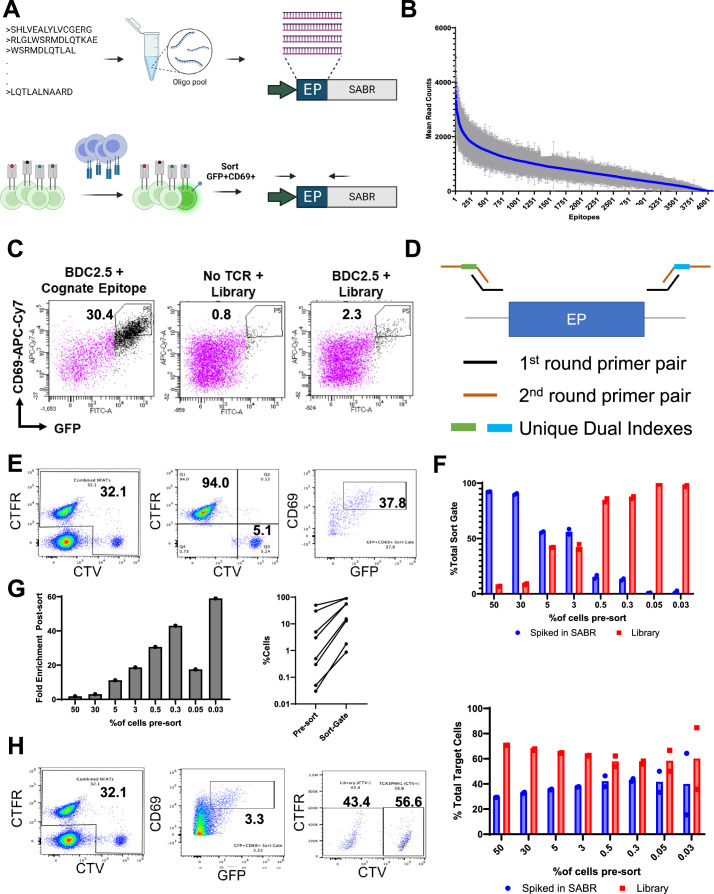
Extended Data Fig. 3. SABR-II library screening.
A. Schematics of the SABR-II library cloning and PCR strategy used for targeted reamplification of gDNA from sorted SABR-II library cells. B. The average read count in the libraries across 8 independent experiments is shown (blue dots) with s.d. (error bars). The x-axis denotes the epitope number (ordered in a descending order of mean read counts). C. Representative flow cytometry plots for SABR-II screen sorts. NFAT-GFP-Jurkat cells expressing the SABR-II library were labeled with cell trace violet, gated, and subsequently used to select top 1–2% of GFP/CD69 double positive cells for sorting. D. PCR indexing strategy for epitopes from gDNA for sequencing of SABR-II screens. E-H. NFAT-GFP-Jurkat cells expressing the I-Ag7 library, which contains no TCR3 target epitopes, were labeled with cell trace far red (CTFR+), and NFAT-GFP-Jurkat cells expressing the TCR3 targeted single SABR-II (QVEQLELNAARDPN) were labeled with cell trace violet (CTV+). The two cell types were mixed at decreasing ratios of the TCR3 targeted SABR-II and incubated against TCR3 expressing Jurkats at a 1:1 Jurkat to NFAT-GFP-Jurkat ratio. E. Gating strategy to identify sensitivity and enrichment of target cells in SABR-II library sort gate. Cells were partitioned by cell trace label then separately analyzed for proportion that fall into the sort gate (1–2% CD69+GFP+ NFAT-GFP-Jurkat cells) in the far-right panel. F. Relative proportion of TCR3 targeted SABR-II cells and library cells in the assay that are captured in the sort gate where bars indicate mean from 3 technical replicates. The x-axis indicates the level of spike in of the TCR3 target single SABR-II. G. Left panel shows the fold enrichment (mean of 3 technical replicates) of spiked in TCR3 target single SABR-II cells after sorting. The x-axis indicates the proportion of target cells spike in as in panel F. The right panel shows the pre- and post-sort proportion of spiked in TCR3 target single SABR-II cells. H. Gating strategy to specifically identify specificity of sort gate. Cells are partitioned by cell trace labeling after their appearance in the sort gate. Right panel shows quantification of the proportion of the TCR3 targeted single SABR-II cells that makeup the total sorted cells vs the untargeted library where bars indicated the mean percentage of total sorted cells from two technical duplicates (dots) across the % of target cells spiked in pre-sort (x-axis).

