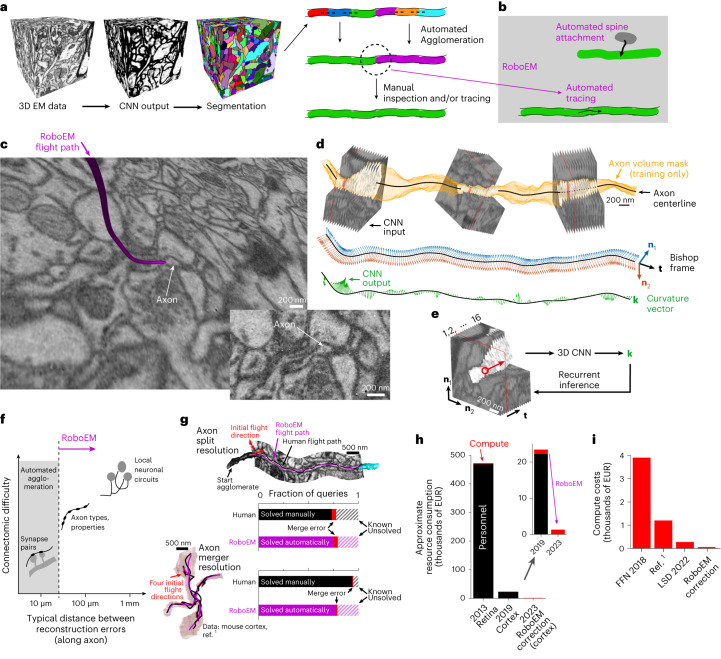
Fig. 1. Automated neurite tracing for substitution of human annotation needs in neuronal network reconstruction.
a, Standard workflow for connectomic analyses from 3D-EM data: initial volume segmentation (two-step process of classification and watershed17,22,24–28, or directly as foreground classification30–32); automated agglomeration (based on interfaces between segments); manual inspection to resolve remaining errors and reach reconstruction quality usable for meaningful connectomic analysis1,2,12,16,19,37–41. Data cubes with 10 µm edge lengths are shown. b, RoboEM replaces human inspection and correction step by automated connection and/or validation flights solving split and merge errors and attaching remaining spine heads1. c, Example of the RoboEM flight path along a thin axon in SBEM data1. d, Design of RoboEM: volumetric EM data as input for prediction of a steering vector that determines the subsequent input. Yellow denotes segmentation mask for ‘teaching’ corrective steering signals from off-center locations (during training, only). e, Detailed sketch of RoboEM inference setup. f, Calibration of reconstruction automation by the difficulty of automatable connectomic analyses comes from synaptic pairs-based analyses1,12,37 via extraction of axonal properties1,21 (Fig. 2b and Supplementary Fig. 1) to local neuronal circuits. g, RoboEM performance in direct comparison to human annotators on axon ending (n = 90) and chiasma queries (n = 100) for split and merge error resolution1. h, Effect on resource consumption for connectomic dense reconstructions. i, Computing costs for state-of-the-art segmentation and agglomeration: FFNs32 and local shape descriptors (LSD)25 are compared against a dense connectomic reconstruction1 (additionally including costs for synapse and type predictions and processing of human and/or RoboEM skeletons). EUR, euros.

