FIGURE 3.

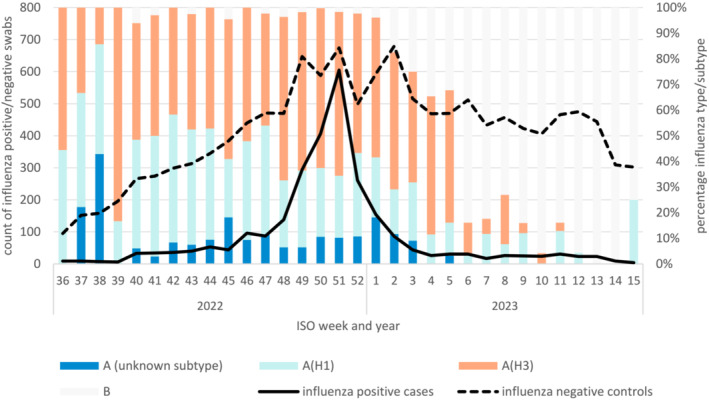
Count of influenza positive cases and influenza negative controls by ISO week swab taken (lines) and the percentage of influenza types or subtypes among influenza positive swabs by ISO week (bars).

Count of influenza positive cases and influenza negative controls by ISO week swab taken (lines) and the percentage of influenza types or subtypes among influenza positive swabs by ISO week (bars).