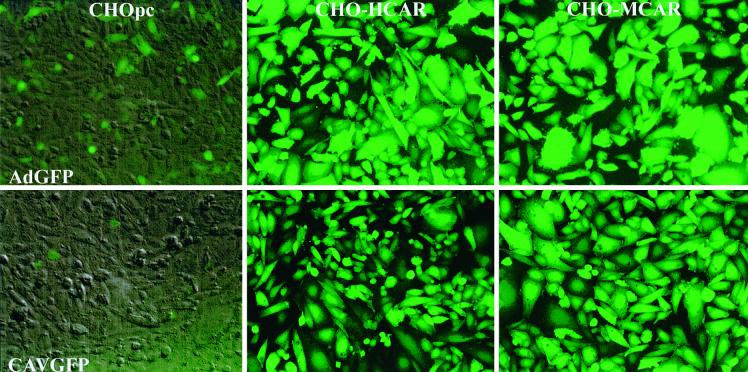
FIG. 1.
CHO cells and derivatives expressing HCAR and MCAR: AdGFP versus CAVGFP. Confluent monolayers were incubated with 103 particles of each vector per cell. At 40 h posttransduction the cells were photographed using an inverted fluorescence microscope and a GFP filter with a bandwidth of 485 to 507 nm. In CHOpc cells the GFP expression is overlaid on a phase-contrast image in order to show the cell density. CAVGFP and AdGFP transduced >85% of CHO-hCAR and CHO-mCAR cells.

