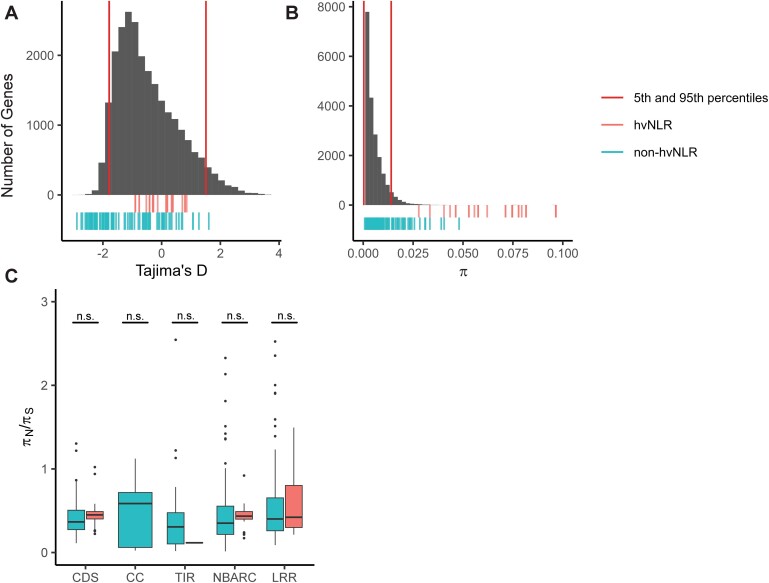
Figure EV3. Comparison of NLR population genetics statistics to the empirical distribution; per NLR domain πN/πS.
(A, B) Empirical distribution of Tajima’s D and π calculated on coding sequences of Arabidopsis shown as a histogram with 50 bins. The position of hv and non-hvNLRs shown via rug plot beneath the histogram, as well as the 5th and 95th percentiles of the distribution. (C) πN/πS calculated per domain. Data Information: (C) horizontal black lines denote median values within each box; boxes range from the 25th to 75th percentile of each group’s distribution of values; whiskers extend no further than 1.5× the interquantile range of the hinge. Data beyond the end of the whiskers are outlying points and are plotted individually. Significance shown is the result of an unpaired Wilcoxon rank-sum test with Benjamini–Hochberg correction for multiple testing. “n.s.” indicates a P value > 0.05. Source data are available online for this figure.

