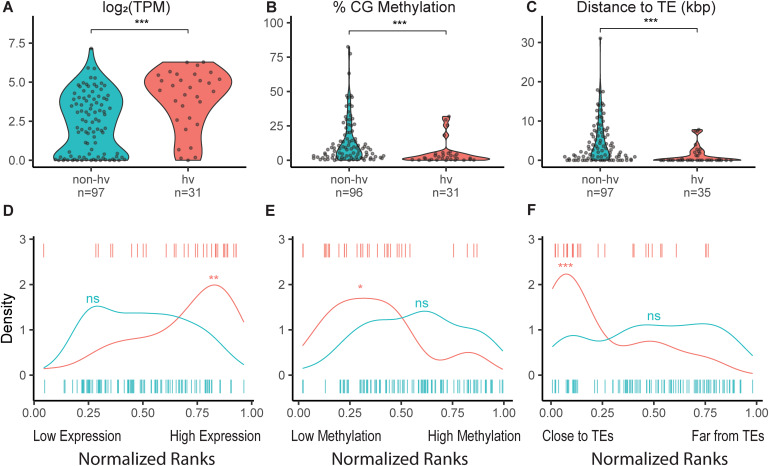
Figure 2. Expression, methylation, and proximity to transposable elements (TEs) distinguish hv and non-hvNLRs in Col-0 rosette tissue.
(A–C) Average gene expression log2 (transcripts per million (TPM)), average % CG methylation per gene, and distance to the nearest TE (kbp) of hv and non-hvNLRs. (D–F) Normalized mean percentile rank density plots of hv and non-hvNLRs. Data Information: (A–C) significance shown is the result of unpaired Wilcoxon rank-sum tests with Benjamini–Hochberg correction for multiple testing. (D–F) The significance shown is the result of singscore rank-based sample scoring or permutation test for difference in means. For description of the statistical test, see “Methods”. “ns“ indicates a P value > 0.05; * indicates a P value < 0.05 and ≥0.01; ** indicates a P value < 0.01 and ≥0.001; *** indicates a P value < 0.001. n refers to the number of NLR genes tested. Source data are available online for this figure.

