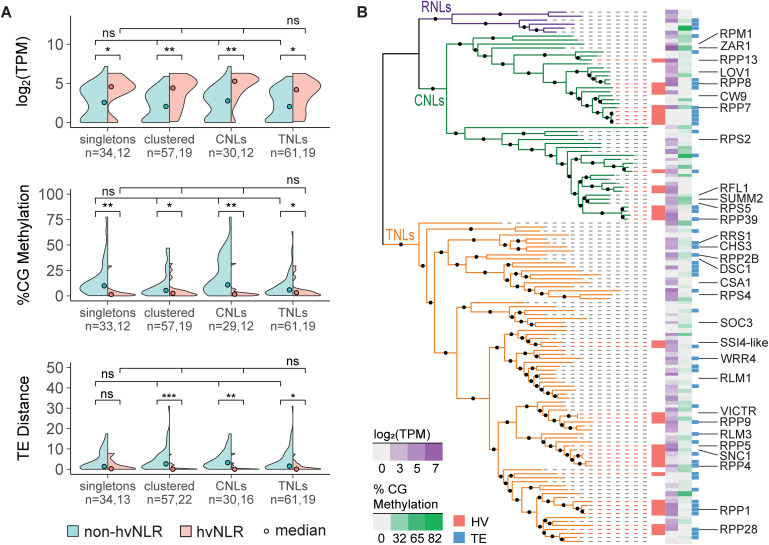
Figure 3. Cluster membership, NLR type, and phylogenetic distance do not explain genomic differences between hv and non-hvNLRs.
(A) Comparison of expression, distance to nearest TE, and CG gene body methylation of hv and non-hvNLRs subset by cluster membership and N-term domain type. (B) Features mapped onto a phylogeny of NLRs in A. thaliana Col-0. NLRs without log2(TPM) or %CG methylation data were determined to be unmappable (see “Methods”). Named NLRs with previous functional characterization are labeled. Data Information: (A) pairwise significance shown is the result of an unpaired Wilcoxon rank-sum test with Benjamini–Hochberg correction for multiple testing. Across subset significance shown is the result of a Kruskal–Wallis test with Benjamini–Hochberg correction for multiple testing. “ns” indicates a P value > 0.05; * indicates a P value <0.05 and ≥0.01; ** indicates a P value < 0.01 and ≥0.001; *** indicates a P value < 0.001. n refers to the number of NLR genes tested in each subset. Source data are available online for this figure.

