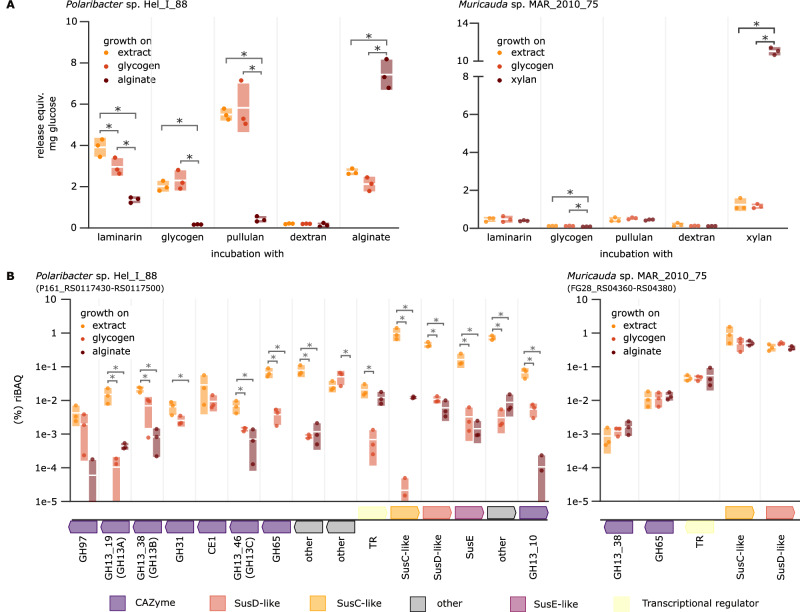
Fig. 6. The α-glucan PUL expression is specifically induced by bacterial α-glucan extracts.
A Lysate activity and α-glucan (B) PUL-encoded protein abundance of Polaribacter sp. Hel_I_88 and Muricauda sp. MAR_2010_75 grown on extracted bacterial polysaccharide (0.2% W/V) as sole carbon source. Samples were taken from biological replicates of growing cultures (n = 3) after 72 h and activity determined by incubating pure culture lysate (normalized for protein concentration determined via BSA-assay) with different polysaccharides. Alginate and xylan were used as controls, respectively. Shown are all non-0 values (dots) as riBAQ (relative identity-based absolute quantification) alongside their standard deviation (bars) and mean (white line). Significance determined by one-way ANOVA followed by post hoc Tukey’s HSD test (p-value < 0.05) is displayed as asterisks above the respective values. The α-glucan PULs of both isolates are depicted beneath the protein abundances and specific CAZyme annotations are provided underneath.

