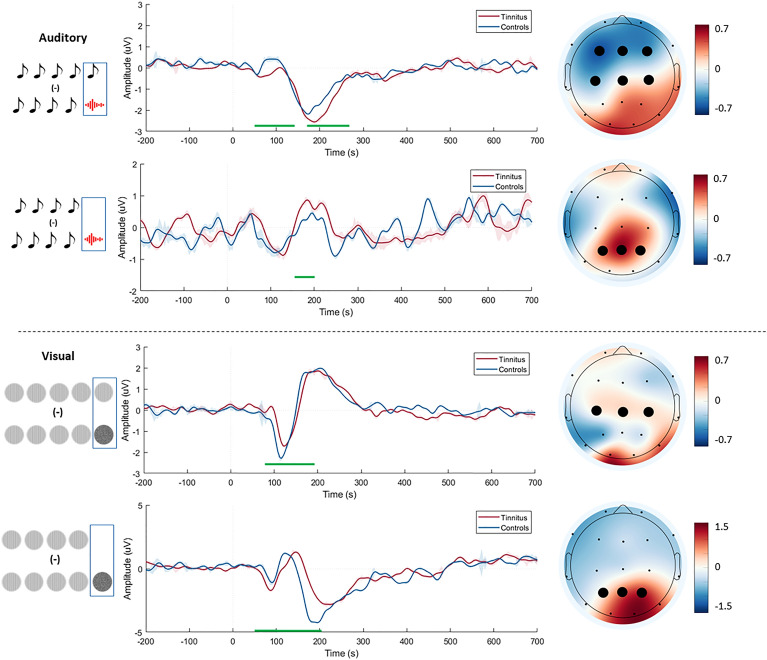
Figure 3.
Scalp maps and event-related potentials for the prediction error generated by the subtraction of the responses of the two deviants and the standard in the MMN timeframe. Scalp maps show the mean amplitude in the mis-match negativity time frame for the difference between the two groups in the auditory (upper section) and visual (lower sections) domains. The event-related potentials show the prediction error response of the controls (blue) and tinnitus (red) group and the significant difference between them (green line). The “0” time point corresponds to the onset of the 5th stimulus in the sequence. The electrodes in BOLD show the electrodes that show a significant difference at all time points indicated by the green line. The red and blue shading around the lines represent the standard error bars of the prediction error signal.

