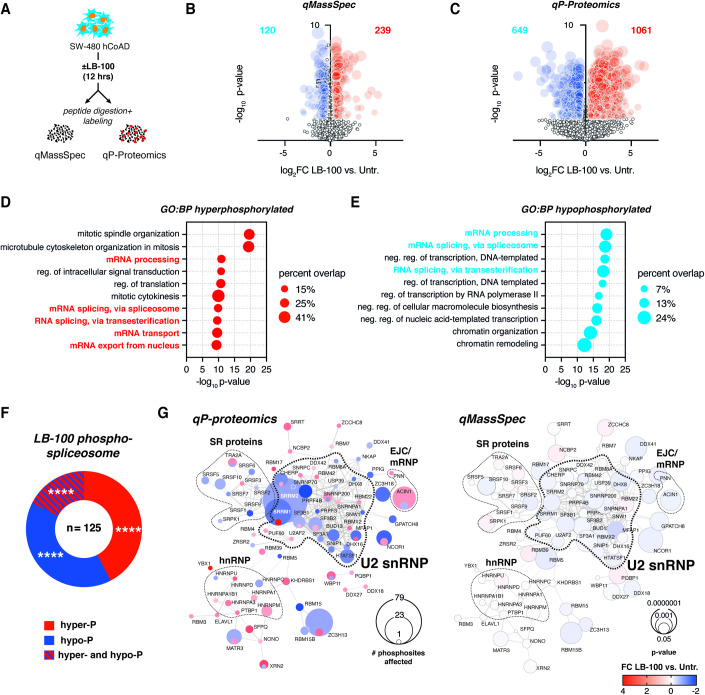
Figure 1. PP2A/PP5 small drug inhibition by LB-100 drives phosphoproteome changes enriched for multiple components of the spliceosome.
(A) Schematic illustrates an experimental approach to determine proteomic (quantitative mass spectrometry, qMassSpec) and phosphoproteomic (qP-Proteomics) changes in response to PP2A/PP5 inhibitor LB-100 in human colorectal adenocarcinoma (hCoAD) cell line SW-480. (B) Volcano plot shows protein expression changes in response to 4 μM LB-100 stimulation (12 h) compared to untreated controls (Untr.). Upregulated (red) and downregulated (blue) proteins with false discovery rate (FDR) <0.05 (t-test) and |Log2FoldChange| >0.58 are shown. (C) Volcano plot shows phosphorylation changes in response to 4 μM LB-100 stimulation (12 h) compared to untreated controls. Hyper- (red) and hypophosphorylated (blue) events with FDR <0.05 (t-test) and |Log2FC| >0.58 are shown. (D) Gene Ontology (GO) analysis for 1061 hyperphosphorylated proteins. BP biological process. (E) GO analysis for 649 hypophosphorylated proteins. (F) The Donut chart shows the distribution of proteins with significantly changed (FDR <0.05 and |Log2FC| >0.58) phosphorylation status. (G) Interaction maps of spliceosome components hyper- and hypophosphorylated (left) in response to 12 h of LB-100 stimulation in SW-480 cells. Corresponding analysis of protein expression changes is shown (right). Connecting lines show interactions from STRINGdb. Data information: In (D, E) p values were calculated with Fisher’s exact test. In (F) ****p < 0.0001 (hypergeometric test vs. background). See also Fig. EV1 and Datasets EV1, EV2.

