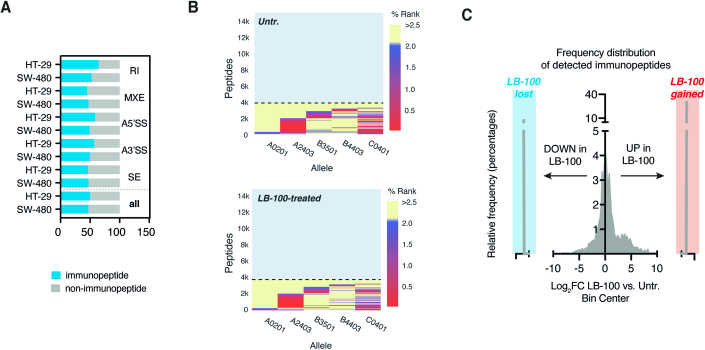
Figure EV5. LB-100 determines neoantigen formation presented within MHC-I.
(A) The bar graph shows an equal contribution of all the splicing events toward the potential formation of tumor neoantigens reported previously (Lu et al, 2021). (B) Heat maps show HLA haplotype representation in untreated controls (Untr.). and LB-100-stimulated HT-29 human colorectal carcinoma cells from n = 3 biological replicates. (C) The plot shows the cumulative distribution of log2 fold change in peptides presentation between LB-100-stimulated and untreated control (Untr.) HT-29 cells from n = 3 biological replicates. Highlighted in red and blue are peptides detected exclusively in LB-100 and control cells, respectively.

