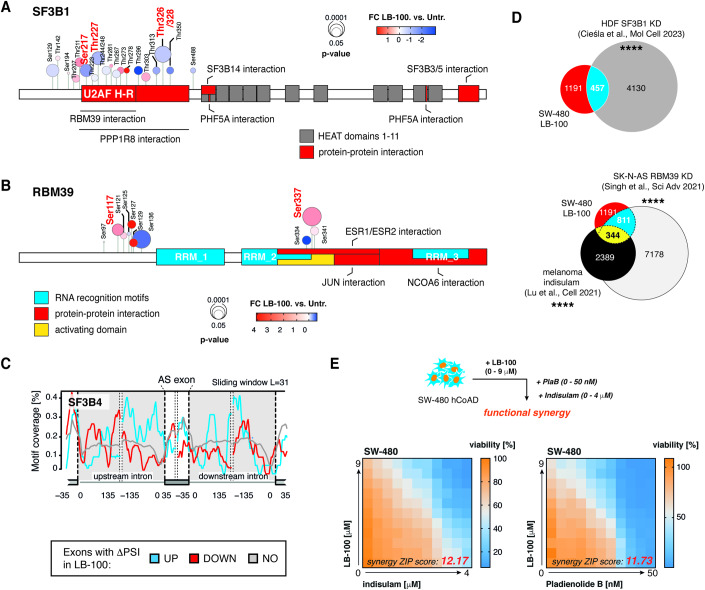
Figure 4. Targets of splicing-targeting drugs are differentially phosphorylated in response to PP2A/PP5 inhibition.
(A,B) Location of mis-phosphorylated sites across SF3B1 (A) and RBM39 (B) proteins. Functionally relevant protein regions according to UniProt are shown. Significantly changing phosphosites in response to LB-100 are highlighted in red. (C) Motif RNA map shows SF3B4 binding in the proximity of excluded (DOWN), included (UP), or not affected (NO) exons in LB-100-treated as compared to untreated SW-480 colorectal adenocarcinoma cells. (D) Venn diagram shows a significant overlap between AS transcripts in LB-100-treated SW-480 cells, SF3B1-depleted MYC-expressing Human Diploid Fibroblasts (HDF) (Cieśla et al, 2023), indisulam-treated melanomas (Lu et al, 2021), and RBM39 knock-down (KD) SK-N-AS neuroblastoma cell line (Singh et al, 2021). (E) Synergy matrices show cooperativity between LB-100 and pladienolide B and indisulam in the SW-480 human adenocarcinoma cell line. Representative heat map for n = 3 biological replicates. A schematic representation of the experiment is shown on top. Data information: In (D) statistical significance was calculated with hypergeometric test, ****p < 0.0001. See also Fig. EV4. Source data are available online for this figure.

