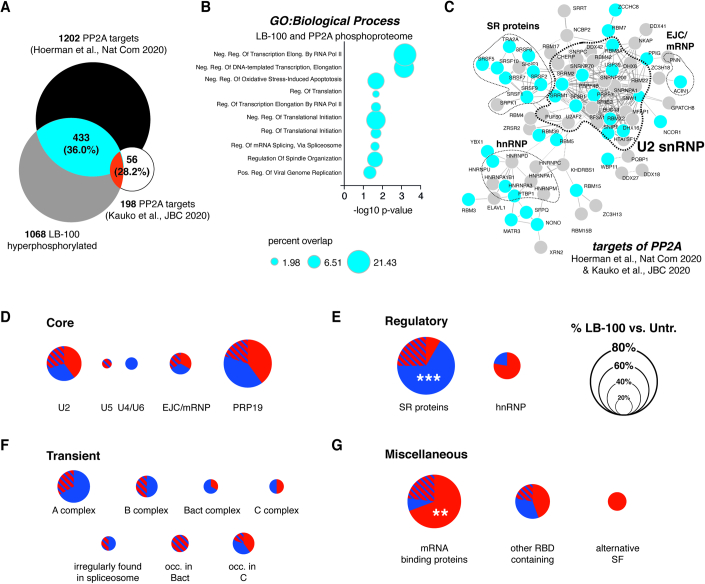
Figure EV1. Specific splicing nodes are differentially phosphorylated in response to LB-100 treatment in colorectal adenocarcinoma.
(A) Venn diagram shows an overlap between differentially hyperphosphorylated proteins in LB-100-treated SW-480 colon adenocarcinomas and previously reported targets of PP2A (Hoermann et al, 2020; Kauko et al, 2020). (B) The bar graph shows Gene Ontologies enriched for 34 differentially phosphorylated proteins from LB-100-treated SW-480 human colorectal carcinoma that are previously reported PP2A targets (Hoermann et al, 2020; Kauko et al, 2020). p values were calculated with Fisher’s exact test. (C) Interaction maps of spliceosome components hyper- and hypophosphorylated in response to 12 h of LB-100 stimulation in SW-480 cells (gray) overlaid with previously reported targets of PP2A (Hoermann et al, 2020; Kauko et al, 2020) (blue). Connecting lines show interactions from STRINGdb. (D–G) Pie charts show the distribution of proteins with significantly changed (FDR <0.05 and |Log2Fold Change| >0.58) phosphorylation status within different functional groups of splicing factors. RBD RNA binding domain, SF splicing factor. Data information: In (D–G), statistical significance was calculated with hypergeometric test vs. background, ***p < 0.001; **p < 0.01.

