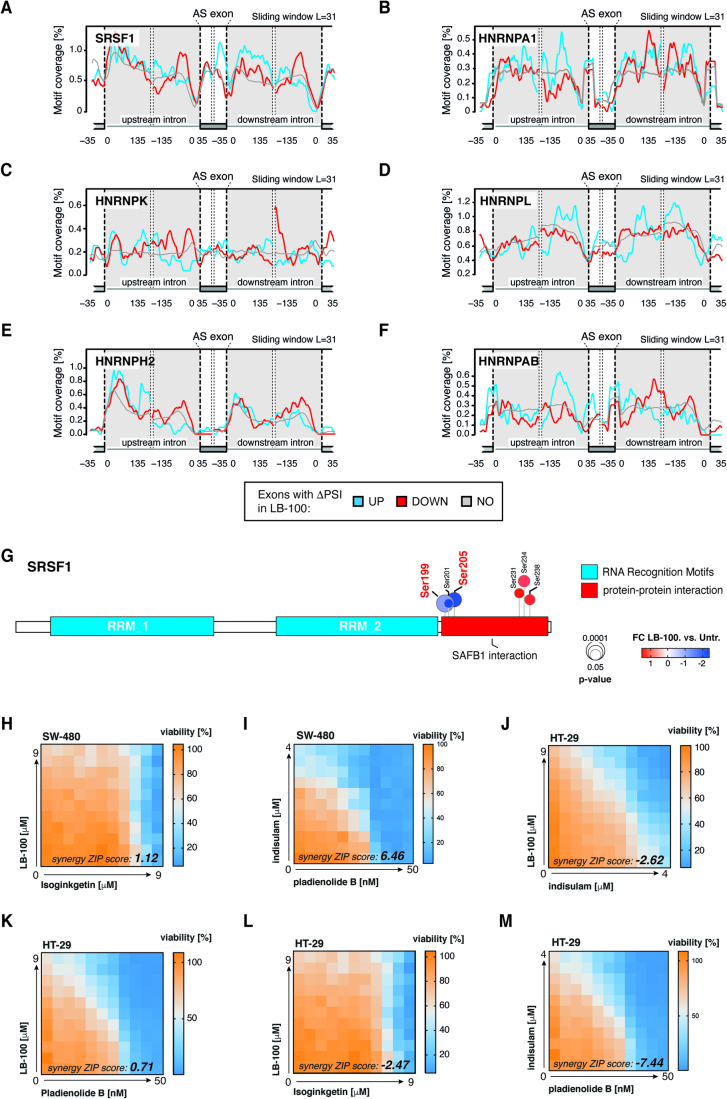
Figure EV4. Impact of LB-100-driven phosphorylation changes on the function of spliceosome components.
(A–F) Motif RNA map shows SRSF1 (A), HNRNPA1 (B), HNRNPK (C), HNRNPL (D), HNRNPH2 (E), and HNRNPAB (F) proteins binding in the proximity of excluded (DOWN), included (UP), or not affected (NO) exons in LB-100-treated as compared to untreated SW-480 colorectal adenocarcinoma cells. (G) Location of mis-phosphorylated sites across SRSF1 protein. Functionally relevant protein regions according to UniProt are shown. Significantly changing phosphosites in response to LB-100 are highlighted. (H,I) Synergy matrices show a lack of cooperativity between LB-100 and isoginkgetin (H) or indisulam and pladienolide B (I) in the SW-480 human adenocarcinoma cell line. Representative heat map for n = 3 biological replicates. (J–M) Synergy matrices show a lack of cooperativity between LB-100 and indisulam (J), pladienolide B (K), isoginkgetin (L), or indisulam and pladienolide B (M) in HT-29 human adenocarcinoma cell line. Representative heat map for n = 3 biological replicates. Source data are available online for this figure.

