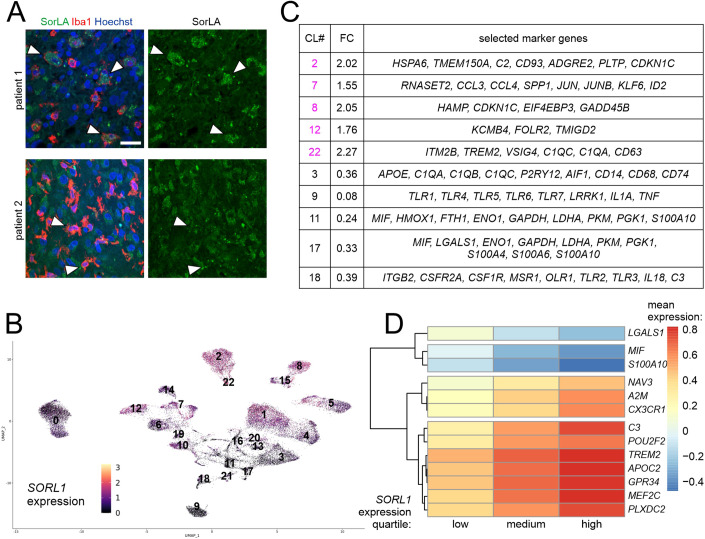
Figure 1. SORL1 expression in human GAMs is linked to their functional properties.
(A) SorLA is present in Iba1+ cells in some patients (#1) but absent from these cells in other cases (#2). White arrowheads indicate selected Iba1+ cells. Scale bars, 25 µm. (B) UMAP plot showing SORL1 expression levels normalized with SCT, in clusters of human GAMs. (C) Selected marker genes of 5 GAMs clusters with the highest and 5 clusters with the lowest SORL1 expression levels. CL#, cluster number; FC, SORL1 expression fold change, mean cluster expression against mean expression in remaining clusters. (D) Hierarchical clustering of the most significant genes based on the mean values of standardized gene expression data. These genes were returned by MCFS-ID with the highest RI values and showed differential expression in the context of discretized values of SORL1 gene expression.

