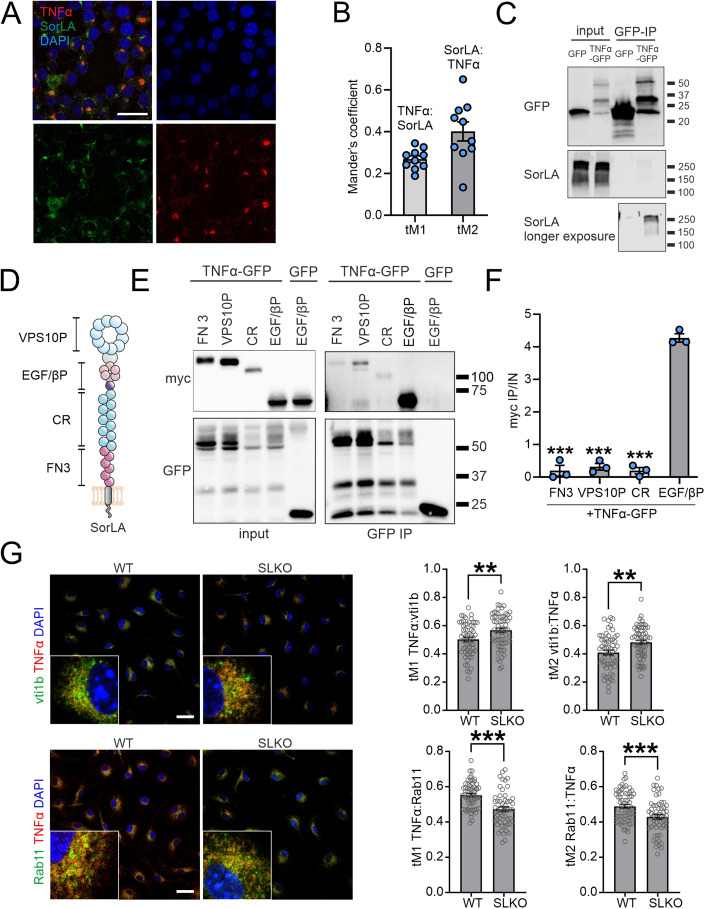
Figure 4. SorLA interacts with TNFα to regulate its subcellular distribution.
(A) Representative image of SorLA and TNFα immunostaining in BV2 microglial cells stimulated with PMA. Cells were counterstained with DAPI. Scale bar: 25 µm. (B) Results of colocalization analysis performed for SorLA and TNFα signals exemplified in (A) calculated as thresholded Manders coefficients (tM). n = 10 fields of view. (C) Co-immunoprecipitation (co-IP) of SorLA with GFP-tagged TNFα overexpressed in HEK293 cells after GFP-IP. GFP serves as a negative control. (D) Scheme of SorLA protein structure indicating its functional domains. VPS10P VPS10P domain, EGF/βP EGF-type repeat/β-propeller domain, CR complement-type repeat, FN3 fibronectin-type III domain. (E) TNFα preferentially binds the EGF/β-propeller SorLA mini-receptor. Co-immunoprecipitation (co-IP) of myc-tagged SorLA mini-receptors with TNFα-GFP overexpressed in HEK293 cells after GFP-IP. GFP serves as a negative control. (F) Ratios of myc signals in co-IP and input samples (IP/IN) calculated for each transfection variant as in (E). n = 3 biological replicates. (G) Immunostaining for TNFα and the markers of secretory vesicles (Vti1b) and recycling endosome (Rab11) in WT and SorLA-KO microglia. Cells were counterstained with DAPI. Representative images (left) and the results of colocalization analysis (right) calculated as thresholded Manders coefficients (tM) are shown. n = 55–64 cells. Scale bar, 25 µm. Data information: (B, F, G) Data are shown as mean ± SEM. **P < 0.01; ***P < 0.001 in one-way ANOVA with Tukey’s multiple comparisons test (compared to EGF/βP; F) or in unpaired two-tailed t test (G). No statistical analysis was performed for (B) as we did not intend to directly compare tM1 and tM2. Source data are available online for this figure.

