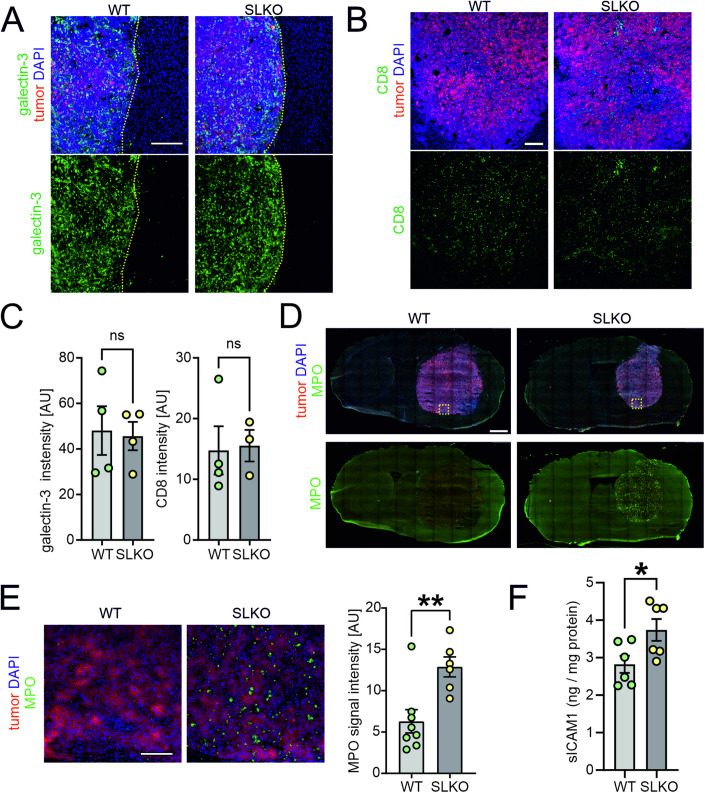
Figure 6. Glioma microenvironment of SorLA-KO mice is infiltrated by neutrophils.
(A, B) Representative images of the sections from glioma-bearing WT and SorLA-KO brains 21 days after implantation of GL261-tdTomato+Luc+ cells, immunostained for the markers of macrophages, galectin-3 (A) and cytotoxic T lymphocytes, CD8 (B). Tumor cells are seen in red. Yellow dotted line marks tumor border. Sections were counterstained with DAPI (blue). Scale bars, 200 µm. (C) Galectin-3 and CD8 signal intensities in WT and SorLA-KO glioma-bearing hemispheres. n = 4 mice per genotype. (D) Representative images of murine brains sections 21 days post-implantation stained for neutrophils marker MPO and counterstained with DAPI (blue). Tumor cells are seen in red. Scale bar, 1 mm. Yellow box indicates the area imaged with higher magnification in (E). (E) MPO+ cells in the glioma mass in WT and SorLA-KO brains. Scale bar, 100 µm. Right panel: quantification of MPO signal intensity observed in WT and SLKO mice. n = 6–8 mice per genotype. (F) Levels of sICAM1 in soluble fractions extracted from glioma-bearing brain hemispheres 21 days post-implantation, normalized to protein content. n = 6 mice per genotype. Data information: (C, E, F) Data are presented as mean ± SEM. ns not significant; *P < 0.05; **P < 0.01 in unpaired two-tailed t test. Source data are available online for this figure.

