
Figure 2.
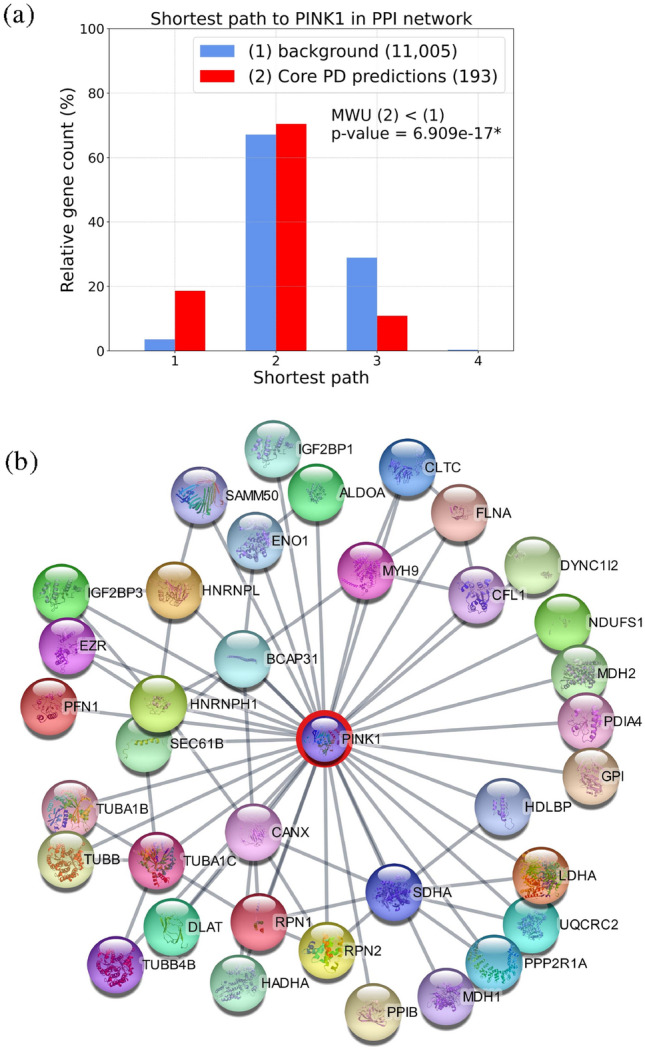
(a) Shortest path length distribution of genes to PINK1gene in the PPI network. We represent the background gene set as group (1) (blue) and Core PD predictions set as group (2) (red), indicating the number of genes in each set in the brackets on the right. MWU (2) < (1) indicates that we perform a one-sided MWU (with a significance level of 0.05) to test if the shortest path distribution of Core PD predictions is significantly smaller than the one of background genes (with p-value indicated by *). (b) PPI network of PINK1and its 36 first neighbours from Core PD predictions. Network visualization was done using Cytoscape 3.10.050.