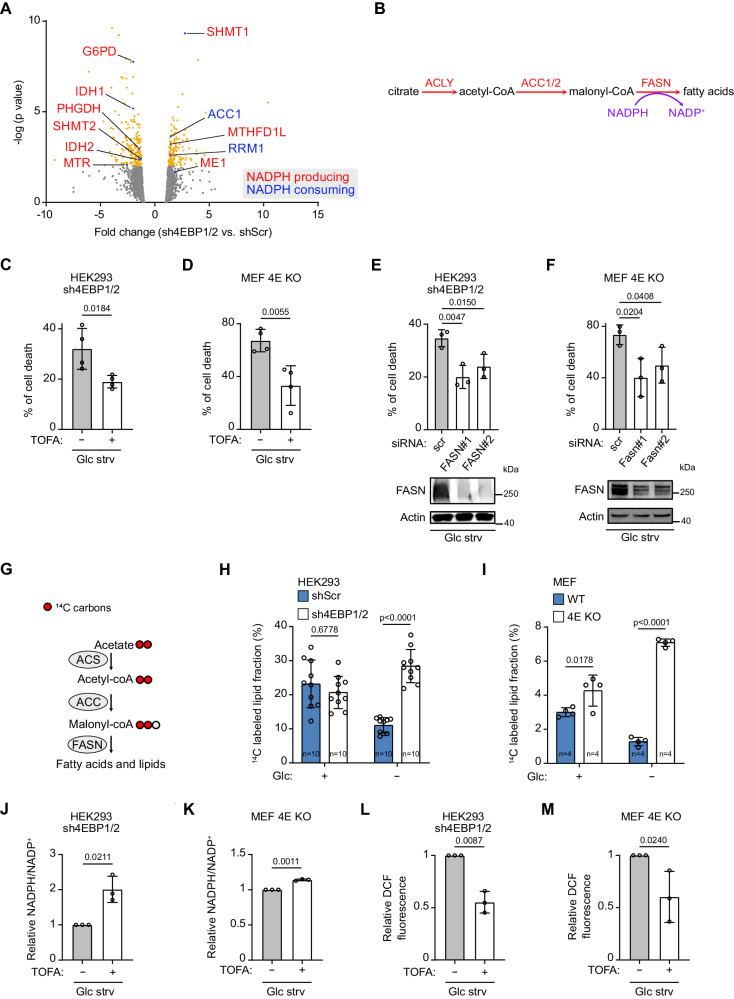
Fig. 3. 4EBP1/2 control fatty acid synthesis activity in response to glucose starvation to preserve redox balance and protect cells.
A Control (shScr) and sh4EBP1/2 HEK293 cells were grown in complete medium or glucose (Glc) starved for 30 h and proteomics was analyzed by MS. Differentially expressed proteins in shScr versus sh4EBP1/2 HEK293 cells under glucose starvation (p-value < 0.05) correspond to yellow and blue dots. Proteins involved in NADPH producing or NADPH consuming processes are highlighted. B Scheme of the fatty acid synthesis pathway highlighting the enzymatic steps and consumption of NAPDH. ACLY: ATP citrate lyase, ACC1/2: acetyl-CoA carboxylase 1/2, FASN: fatty acid synthase. C, D The indicated cell lines were grown in glucose starved medium (Glc strv) with or without TOFA for 48 h. Cell death was measured by PI staining and flow cytometry. E, F The indicated cell lines were transfected with control siRNA (scr) or siRNAs targeting FASN and glucose starved (Glc strv) for 48 h. Cell death was analyzed as in (C, D). FASN protein levels were analyzed by immunoblotting. G Scheme of the [14C] acetate labeling assay to measure fatty acid synthesis activity. ACS: acetyl-CoA synthetase, ACC: acetyl-CoA carboxylase, FASN: fatty acid synthase. H, I The indicated cell lines grown in complete medium or glucose (Glc) starved for 24 h were labeled with [14C] acetate in the last 18 h. [14C] was measured in the lipid fraction and normalized to total protein levels. In (H), n = 10 biological replicates, and in (I), n = 4 biological replicates. (J, K) The indicated cell lines were glucose starved (Glc strv) for 24 h with or without TOFA, and NADP+ and NADPH levels were measured. (L, M) The indicated cell lines were glucose starved (Glc strv) for 24 h with or without TOFA were labelled with CM-DCFDA and analyzed by flow cytometry. Data are shown as the mean ± SD. Statistics: unpaired one-sided Student’s t test (C–F, J–M), two way ANOVA (H, I); n = 3 independent experiments for (C–F, J–M). Source data are provided as a Source Data file.

