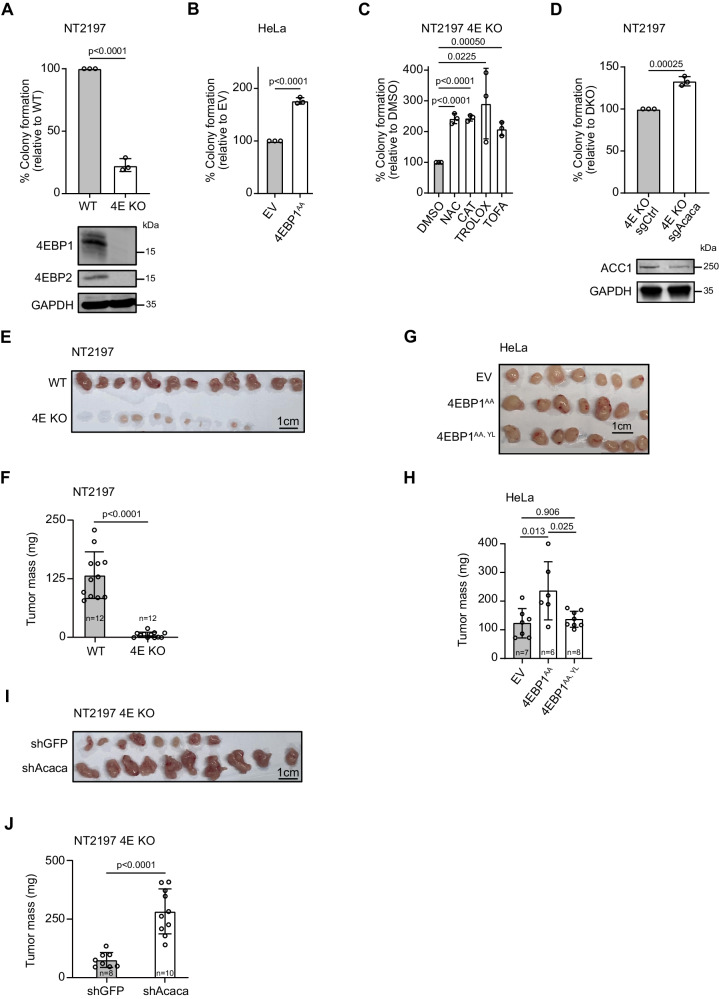
Fig. 5. 4EBP1 supports oncogenic transformation in vitro and in vivo.
A, B WT and 4EBP1/4EBP2 DKO (4E KO) NT2197 (A), or empty vector (EV) and 4EBP1AA expressing HeLa cells (B) were grown in soft agar for 21 days. Colonies and single cells were counted, and colony formation efficiency was calculated and normalized to respective control. Protein expression of 4EBP1 and 4EBP2 was analyzed by immunoblotting. C 4E KO NT2197 cells were grown in soft agar for 21 days and treated with DMSO, NAC, CAT, TROLOX or TOFA. Colonies and single cells were counted, and colony formation efficiency was calculated and normalized to DMSO. D Control (sgCtrl) and ACC1 targeting CRISPRi (sgAcaca) 4E KO NT2197 cells were grown in soft agar for 21 days. Colony formation efficiency and proteins level were analyzed as in (A, B). n = 3 independent experiments for (A–D). E, F WT or 4E KO NT2197 cells were injected in the mammary fat pad of NOD SCID gamma mice. Tumors were harvested, photographed (E) and weighed (F). n = 12 mice per cell line. G, H EV, 4EBP1AA or 4EBP1AA, YL expressing HeLa cells were injected in the flank of NOD SCID gamma mice. Tumors were harvested, photographed (G) and weighed (H). n = 6–8 mice per cell line. I, J Control (shGFP) or stable ACC1 knock down (shAcaca) 4E KO NT2197 cells were injected in the flank of NOD SCID gamma mice. Tumors were harvested, photographed (I) and weighed (J). n = 8–10 mice per cell line. Data are shown as the mean ± SD. Statistics: unpaired one-sided Student’s t test (A–D), two way ANOVA (F, H, J). Source data are provided as a Source Data file.

