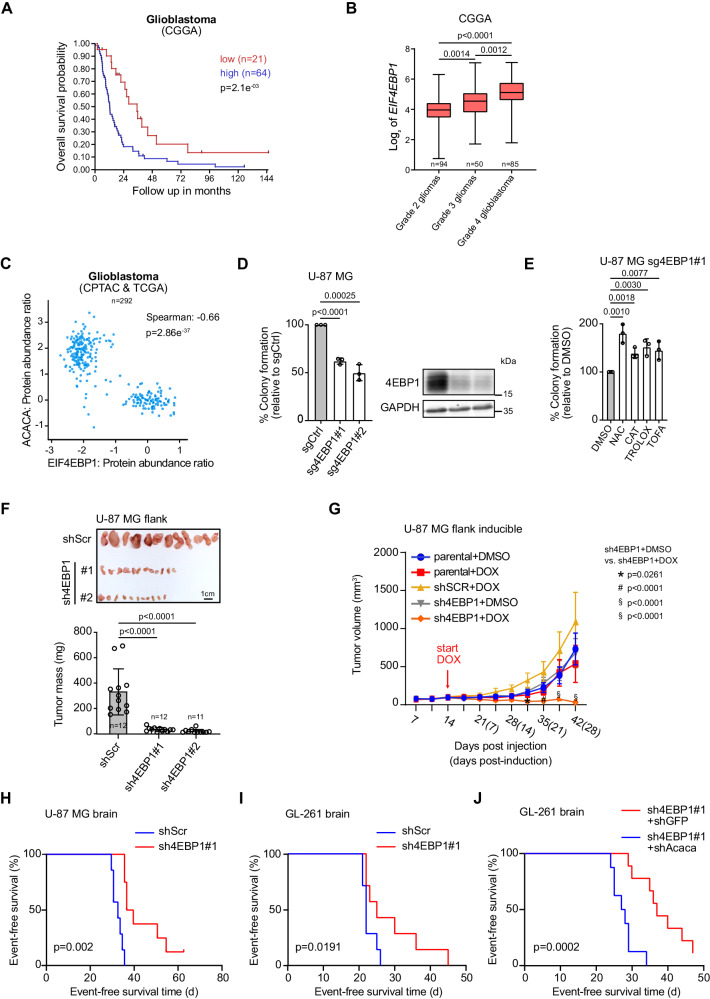
Fig. 6. 4EBP1 has clinical relevance in glioma and promotes glioma tumorigenesis.
A Kaplan-Meier survival estimates of glioblastoma patients stratified by their EIF4EBP1 mRNA levels (cut off first quartile) in the CGGA cohort. p-values were calculated using a log rank test. B Expression levels of EIF4EBP1 per glioma grade in the CGGA cohort. Data were shown as boxplots with medians, interquartile ranges and lower/upper whiskers in. p-values were calculated using an unpaired and two-tailed parametric t test. C 4EBP1 protein levels plotted against the expression levels of ACC1 protein using CPTAC and TCGA GBM proteomic data. Co-expression level was quantified by calculating the Spearman’s correlation coefficient. D, E The indicated cell lines were grown in soft agar for 21 days and were treated (E) or not (D) with the indicated compounds. n = 3 independent experiments. 4EBP1 protein levels were analyzed by immunoblotting (D). p-values were calculated using an unpaired and one-tailed Student’s t test. F The indicated cell lines were injected in the flank of NOD SCID gamma mice. Tumors were harvested, photographed and weighed. n = 11–12 mice per cell line. p-values were calculated using two way ANOVA. G The indicated cell lines were injected in the flank of NOD SCID gamma mice. When tumors reached 100 mm3, mice were given doxycycline (DOX) or vehicle. Tumor volumes were measured at the indicated times. n = 12 mice per cell line. p-values were calculated using two way ANOVA. H ShScr (n = 7 mice) or sh4EBP1#1 (n = 8 mice) U-87 MG cells were injected intracranially in NOD SCID gamma mice. Survival of mice was monitored post injection. I ShScr (n = 10 mice) or sh4EBP1#1 (n = 10 mice) GL-261 cells were injected intracranially in C57WT mice. Survival of mice was monitored post injection. J sh4EBP1#1 containing shGFP (n = 9 mice) or shAcaca (n = 8 mice) GL-261 cells were injected intracranially in C57WT mice. Survival of mice was monitored post injection. p value was calculated using a log rank test for (H–J). Data are shown as the mean ± SD. Source data are provided as a Source Data file.

