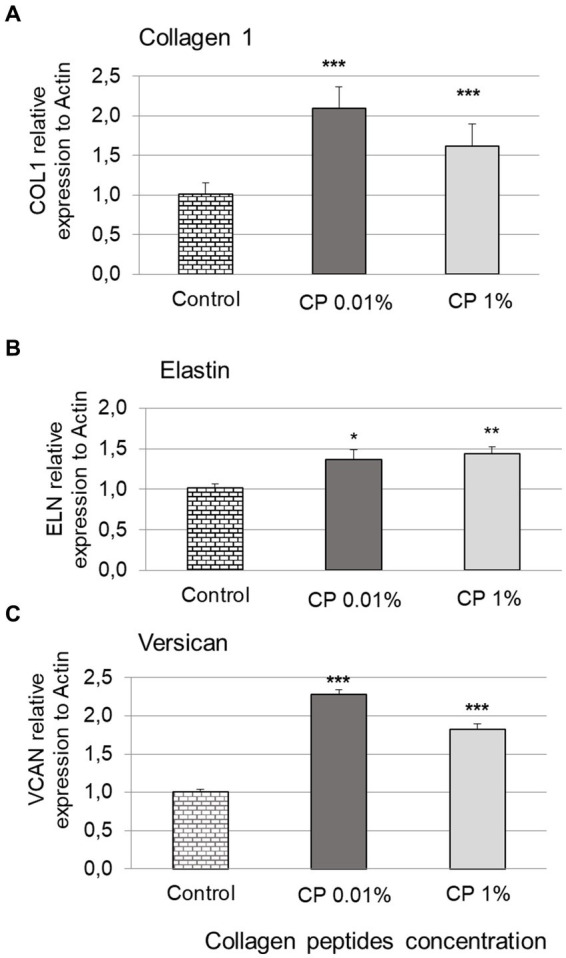
Figure 2.

Gene expression levels. Bar graphs showing the expression results of COL1A1 (A), ELN (B), and VCAN (C) after treating normal human dermal fibroblasts (NHDF) for 24 h with collagen peptides (CP) at 0.01 and 1%, compared to the untreated control. Represents statistical significance with *p value <0.05. ** p value <0.01. *** p value <0.0001.
