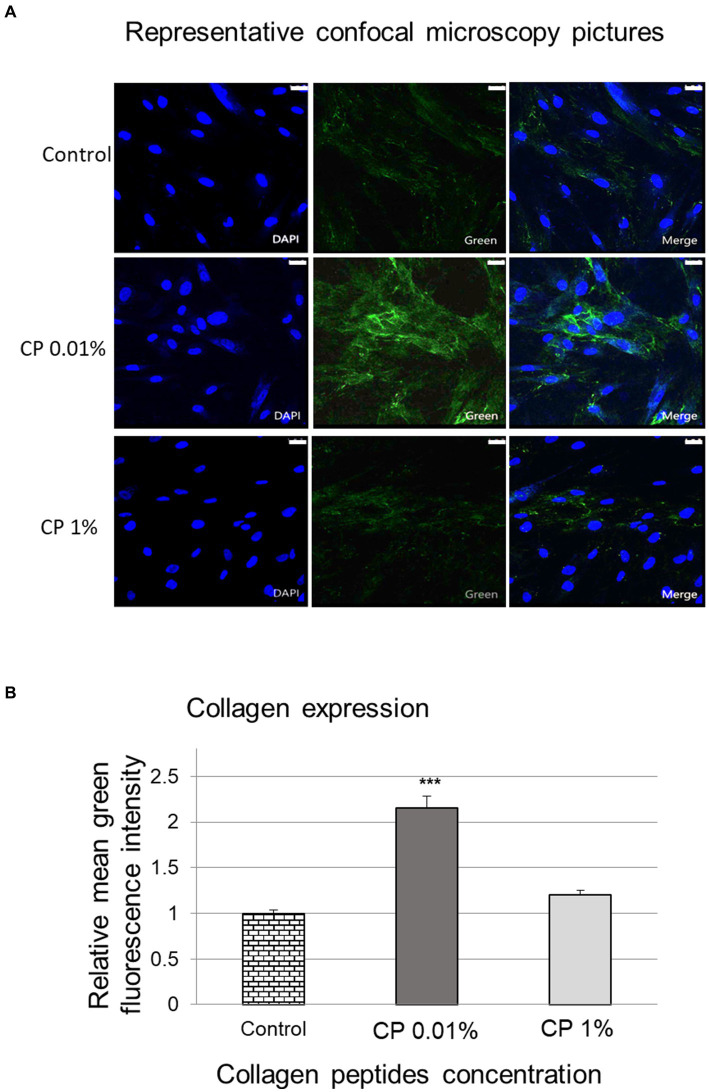
Figure 3.
Imaging of collagen by confocal microscopy. Representative confocal microscopy images (scale bar = 25 μm) showing dermal fibroblasts (blue) and collagen fibers (green) (A). The bar graph shows the mean fluorescence intensity of collagen fibers obtained from the confocal microscopy (B), after treatment of normal human dermal fibroblasts with collagen peptides at 0.01 and 1% for 24 h compared to the untreated control. *** Represents statistical significance with p value <0.0001.

