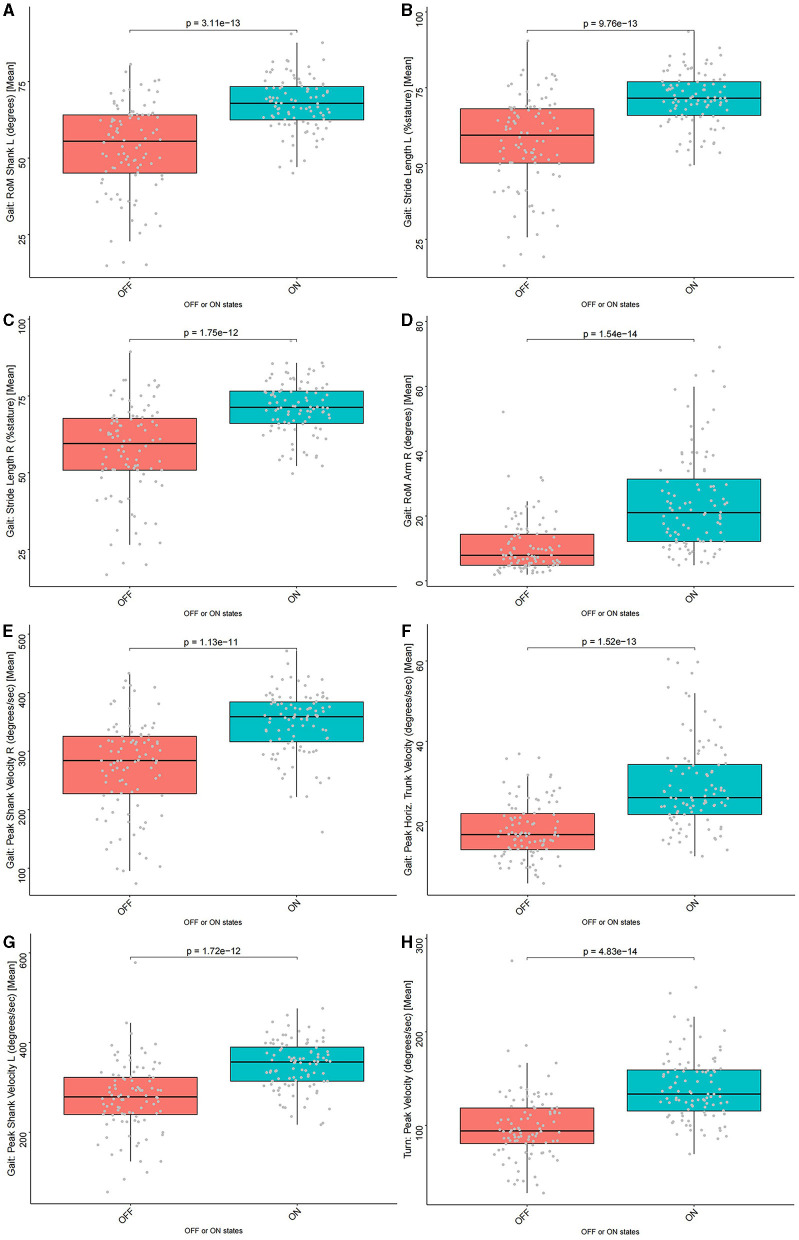
Figure 5.
The comparison of eight motor feature values between the “OFF” and “ON” status. All motor features had significantly higher values in the “ON” status than in the “OFF” status (p < 0.05). (A) Gait: RoM Shank L (degrees) [Mean] (p = 3.11e-13), (B) Gait: Stride Length L (%stature) [Mean] (p = 9.76e-13), (C) Gait: Stride Length R (%stature) [Mean] (p = 1.75e-12), (D) Gait: RoM Arm R (degrees) [Mean] (p = 1.54e-14), (E) Gait: Peak Shank Velocity R (degrees/s) [Mean] (p = 1.13e-11), (F) Gait: Peak Horiz. Trunk Velocity (degrees/s) [Mean] (p = 1.52e-13), (G) Gait: Peak Shank Velocity L (degrees/s) [Mean] (p = 1.72e-12), and (H) Turn: Peak Velocity (degrees/s) [Mean] (p = 4.83e-14).

