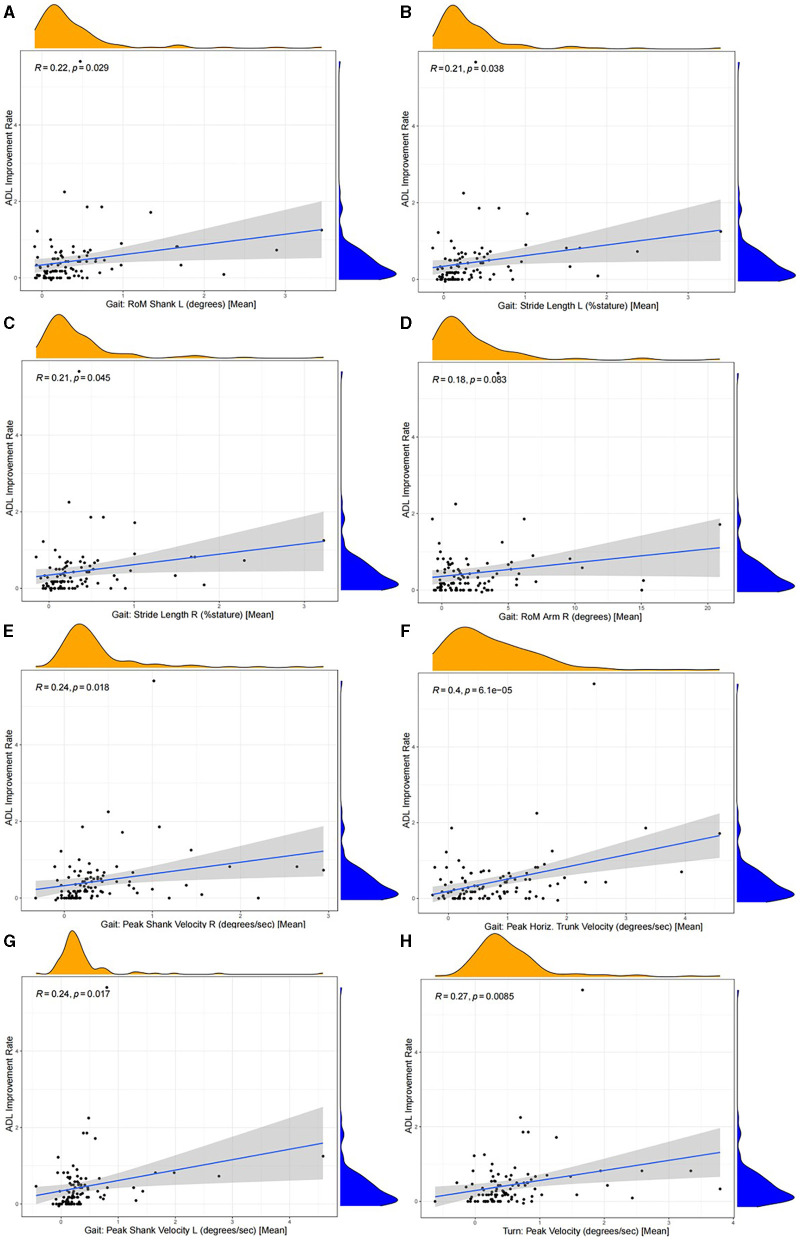
Figure 6.
The correlation (Pearson correlation analysis) between the improvement rate of each motor feature and the ADL improvement rate. The improvement rate of each motor feature was significantly correlated positively with the ADL improvement rate of patients (p < 0.05), except for Gait: RoM Arm R (degrees) [Mean] (R = 0.18, p = 0.083). (A) Gait: RoM Shank L (degrees) [Mean] (R = 0.22, p = 0.029), (B) Gait: Stride Length L (%stature) [Mean] (R = 0.21, p = 0.038), (C) Gait: Stride Length R (%stature) [Mean] (R = 0.21, p = 0.045), (D) Gait: RoM Arm R (degrees) [Mean] (R = 0.18, p = 0.083), (E) Gait: Peak Shank Velocity R (degrees/s) [Mean] (R = 0.24, p = 0.018), (F) Gait: Peak Horiz. Trunk Velocity (degrees/s) [Mean] (R = 0.4, p = 6.1e−05), (G) Gait: Peak Shank Velocity L (degrees/s) [Mean] (R = 0.24, p = 0.017), and (H) Turn: Peak Velocity (degrees/s) [Mean] (R = 0.27, p = 0.0085).

