. 2024 Mar 19;84(10):1680–1698. doi: 10.1158/0008-5472.CAN-23-2701

Figure 3.

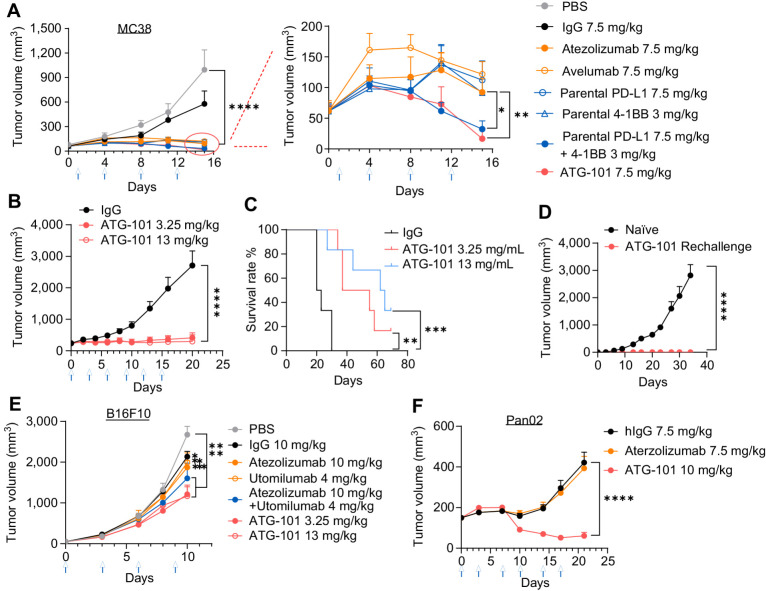
Figure 3. ATG-101 shows antitumor efficacy in vivo. A–D, MC38 colon cancer xenograft model on h4-1BB KI mice (C57BL/6). A, When the TV reached about 60 mm3 (day 0), the mice were treated with indicated antibody twice a week for 2 weeks (n = 5 for PBS; n = 6 for the others). B and C, In another MC38 xenograft model, when the TV reached about 239 mm3, the mice were grouped and treated with indicated antibody twice a week for 2 weeks (n = 5 for PBS; n = 6 for the other groups). Growth curves of MC38 tumor (B) and Kaplan–Meier survival plot of mice (C). D, Tumor-free mice from B were rechallenged with MC38. ATG-101 cured (n = 2) or naïve mice (n = 3). E, and F, B16F10 melanoma model or Pan02 pancreatic tumor model on h4-1BB KI mice. The mice were intraperitoneally injected with tested articles once every 3 days (n = 8). In A, B, D, E, and F, means ± SEM are shown. Statistical analysis used two-way ANOVA for tumor growth comparison and log-rank test (Mantel–Cox) for survival analysis. *, P < 0.05; **, P < 0.01; ***, P < 0.001; ****, P < 0.0001. In the tumor growth curves, only P values on the last day were shown except for B16F10 whose P value on day 10 is shown.

ATG-101 shows antitumor efficacy in vivo. A–D, MC38 colon cancer xenograft model on h4-1BB KI mice (C57BL/6). A, When the TV reached about 60 mm3 (day 0), the mice were treated with indicated antibody twice a week for 2 weeks (n = 5 for PBS; n = 6 for the others). B and C, In another MC38 xenograft model, when the TV reached about 239 mm3, the mice were grouped and treated with indicated antibody twice a week for 2 weeks (n = 5 for PBS; n = 6 for the other groups). Growth curves of MC38 tumor (B) and Kaplan–Meier survival plot of mice (C). D, Tumor-free mice from B were rechallenged with MC38. ATG-101 cured (n = 2) or naïve mice (n = 3). E, and F, B16F10 melanoma model or Pan02 pancreatic tumor model on h4-1BB KI mice. The mice were intraperitoneally injected with tested articles once every 3 days (n = 8). In A, B, D, E, and F, means ± SEM are shown. Statistical analysis used two-way ANOVA for tumor growth comparison and log-rank test (Mantel–Cox) for survival analysis. *, P < 0.05; **, P < 0.01; ***, P < 0.001; ****, P < 0.0001. In the tumor growth curves, only P values on the last day were shown except for B16F10 whose P value on day 10 is shown.