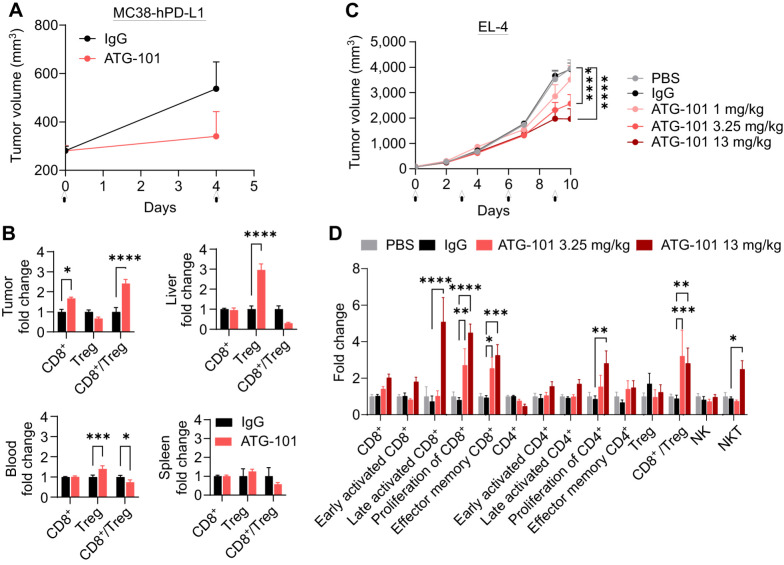
Figure 4.
ATG-101 enhances the antitumor immunity in the TME. A, Growth curves of MC38-hPD-L1 colon tumors treated with IgG or ATG-101 on day 0 and day 4, as indicated by arrow. B, Normalized CD8+ T-cell and Treg number in tumor, liver, blood, and spleen from A. Forty-eight hours after the last administration, the samples were collected. Fold change indicates ATG-101 treatment group versus mean value of IgG control group. C, Growth curves of EL4 T-cell lymphoma. When the tumor size reached about 71 mm3, the mice (n = 8) were grouped and treated with PBS, IgG, or ATG-101. D, Normalized TIL analysis results from tumors from C. The makers used to classify the cell subsets in flow cytometry analysis are summarized in Supplementary Table S2. Fold change indicates IgG or ATG-101 treatment group versus mean valve of PBS group. Means ± SEM are shown. *, P < 0.05; **, P < 0.01; ***, P < 0.001; ****, P < 0.0001 by two-way ANOVA. In the tumor growth curves, only P values on the last day are shown.

