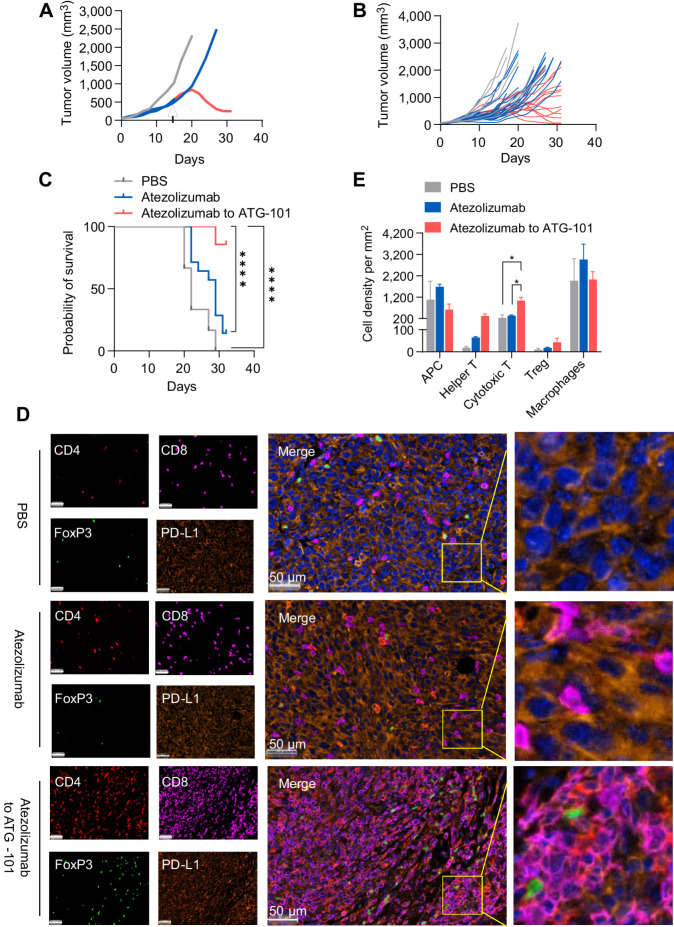
Figure 5.
ATG-101 demonstrates in vivo efficacy in MC38 tumor model progressing on anti-PD-L1 treatment, enhancing the antitumor immunity in the TME. A, Representative individual MC38 tumor growth curve. The mice were treated with PBS (black), 10 mg/kg atezolizumab only (red), or mice initially treated with 10 mg/kg atezolizumab and switched to 13 mg/kg ATG-101 upon disease progression (red to blue). Arrow, the day switching atezolizumab to ATG-101. B, Individual tumor growth spaghetti plots of mice treated with PBS (black; n = 6), atezolizumab only (red; n = 14), and atezolizumab to ATG-101 (red-blue; n = 14). C, Survival data of mouse shown in B. ****, P < 0.0001 by log-rank (Mantel–Cox) test. D, Representative images of multiplex IHC staining of tumor samples collected from mouse from B. The tumor slices were stained for CD4 (Th cell; red), CD8 (effector T cell; purple), Foxp3 (Treg; green), and PD-L1 (cancer cells; dark orange). Nucleus was labeled with DAPI (blue). Insets in the merged images are enlarged. Scale bars, 50 μm. E, Quantitative analysis of cell density of infiltrated immune cell in D. Statistical analysis used one-way ANOVA. *, P < 0.05. Means ± SEM are shown. n = 3 in PBS and atezolizumab group; n = 6 in ATG-101 group.

