. 2024 Mar 19;84(10):1680–1698. doi: 10.1158/0008-5472.CAN-23-2701

Figure 8.

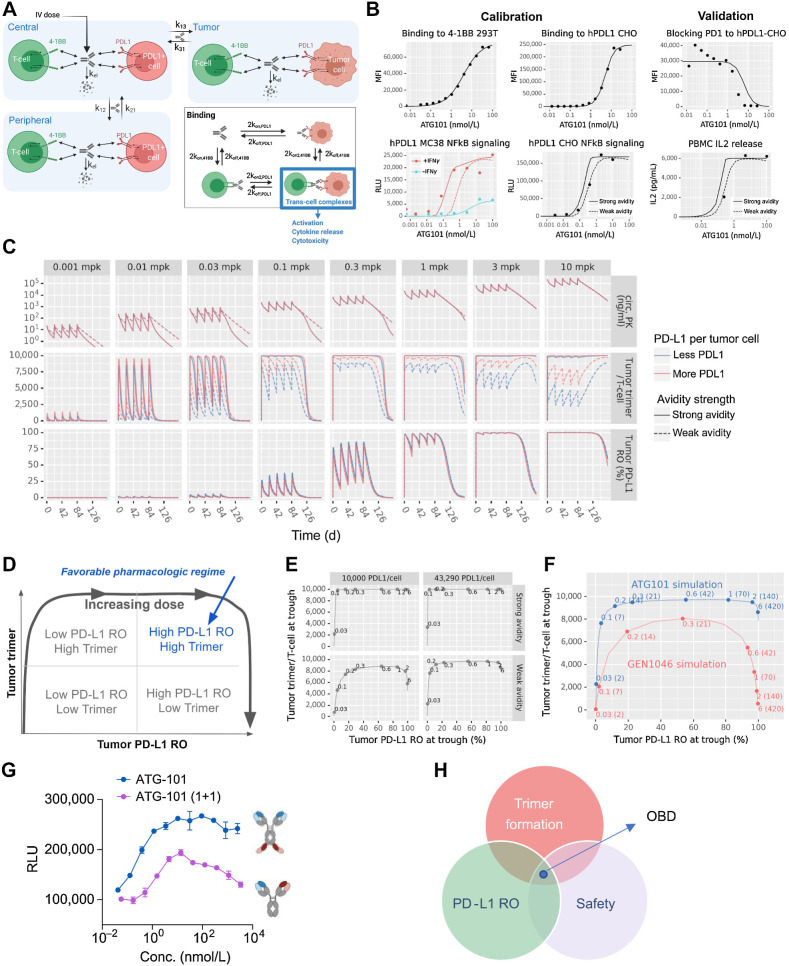
Figure 8. Semimechanistic pharmacology model of ATG-101. A, In vitro model diagram. The model has three compartments: a central compartment, representing the circulation; a tumor compartment; and a peripheral compartment, representing other tissues into which the drug distributes. Drug binds to either receptor initially, then cross-link to the other. Trans-cell complexes (i.e., trimers) are assumed to drive the pharmacologic activity of ATG-101. B, In vitro model calibration and validation. Two cross-linking rates (“strong avidity” and “weak avidity” lines) were calibrated to capture the uncertainty in the parameter (calibration; left). The model was validated with PD-1/PD-L1 blocking assays (validation; right). Lines show model predictions and points show data values for CHO cells expressing hPD-L1 and mPD-L1. C, In vivo human solid tumor model predictions. The in vivo human solid tumor patient model was used to simulate five doses administered every 3 weeks at levels from 0.001 to 10 mg/kg and predict circulating free drug levels, tumor trimer formation, and tumor PD-L1 RO over time. The cross-linking rate and PD-L1 per tumor cell were varied to include the effects of parameter uncertainty and variability in the predictions. D–F, Human model simulated trimer versus PD-L1 RO. D, Schematic representing the pharmacologic regimes between trimer formation and RO of PD-L1. E, Simulations of trimer formation versus PD-L1 RO in high versus low PD-L1 density and high versus low cross-linking avidity for ATG-101 at once every 3 weeks. F, As in the previous panel, the x-axis indicates the tumor cell PD-L1 RO at trough. The y-axis indicates the number of trimers per tumor-infiltrating T cell at trough. Points indicate select doses, with text indicating the dose level in mg/kg outside the parentheses and mg inside the parentheses. Panels indicate the dosing frequency. G, NFκB signaling assays of tetravalent ATG-101 and bivalent ATG-101 in 4-1BB activation. H, Schematic outlining the features of the optimal dose of ATG-101. There is a “sweet spot” between trimer formulation, PD-L1 RO, and BsAb safety. OBD, optimal biological dose.

Semimechanistic pharmacology model of ATG-101. A,In vitro model diagram. The model has three compartments: a central compartment, representing the circulation; a tumor compartment; and a peripheral compartment, representing other tissues into which the drug distributes. Drug binds to either receptor initially, then cross-link to the other. Trans-cell complexes (i.e., trimers) are assumed to drive the pharmacologic activity of ATG-101. B,In vitro model calibration and validation. Two cross-linking rates (“strong avidity” and “weak avidity” lines) were calibrated to capture the uncertainty in the parameter (calibration; left). The model was validated with PD-1/PD-L1 blocking assays (validation; right). Lines show model predictions and points show data values for CHO cells expressing hPD-L1 and mPD-L1. C,In vivo human solid tumor model predictions. The in vivo human solid tumor patient model was used to simulate five doses administered every 3 weeks at levels from 0.001 to 10 mg/kg and predict circulating free drug levels, tumor trimer formation, and tumor PD-L1 RO over time. The cross-linking rate and PD-L1 per tumor cell were varied to include the effects of parameter uncertainty and variability in the predictions. D–F, Human model simulated trimer versus PD-L1 RO. D, Schematic representing the pharmacologic regimes between trimer formation and RO of PD-L1. E, Simulations of trimer formation versus PD-L1 RO in high versus low PD-L1 density and high versus low cross-linking avidity for ATG-101 at once every 3 weeks. F, As in the previous panel, the x-axis indicates the tumor cell PD-L1 RO at trough. The y-axis indicates the number of trimers per tumor-infiltrating T cell at trough. Points indicate select doses, with text indicating the dose level in mg/kg outside the parentheses and mg inside the parentheses. Panels indicate the dosing frequency. G, NFκB signaling assays of tetravalent ATG-101 and bivalent ATG-101 in 4-1BB activation. H, Schematic outlining the features of the optimal dose of ATG-101. There is a “sweet spot” between trimer formulation, PD-L1 RO, and BsAb safety. OBD, optimal biological dose.