Figure. 5.
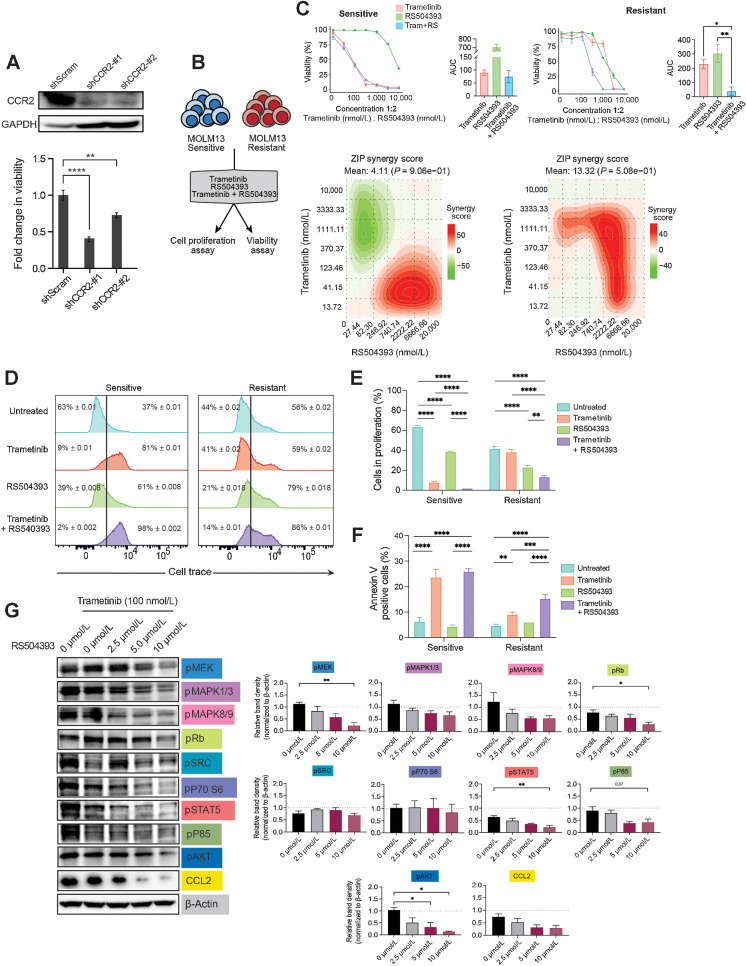
Targeting CCR2 in combination with trametinib reduced AML cell viability, cell proliferation, and induced apoptosis. A, Immunoblot analysis of CCR2 using trametinib-resistant MOLM13 cells expressing shRNAs for scrambled control and CCR2 (sh#1 and sh#2). GAPDH was used as a loading control (top). An equal number of cells was plated, and the viability of shRNA-transduced cells was determined by an MTS cell viability assay after 72 hours in culture. The data are represented as fold change over scrambled control shRNAs. Statistical significance was determined via the two-way ANOVA. B, The cell proliferation and viability assays performed with MOLM13 trametinib-resistant and sensitive cell lines. C, Drug–response curve of trametinib-sensitive (S) and -resistant (R) MOLM13 cells treated with trametinib (0.004–10 μmol/L) and RS540393 (0.008–20 μmol/L) for 7 days, as determined using the MTS cell viability assay. Significance was calculated using one-way ANOVA with multiple comparisons, where P ≤ 0.05 was considered significant. D, Representative flow cytometry histograms showing levels of cell trace violet in the sensitive and trametinib-resistant MOLM13 cell lines after 48 hours of treatment with either 100 nmol/L trametinib or 2.5 μmol/L RS504393, or their combination. E, Bar graphs of data in D, representing the percentage of proliferating cells compared with untreated control in respective cell lines. Data are plotted as mean ± SEM. Significance as calculated using the two-way ANOVA. The data are representative of three independent experiments. F, Representative plots of Annexin V and 7-AAD staining from trametinib-sensitive (S) and -resistant (R) MOLM13 cells treated with 100 nmol/L trametinib or 2.5 μmol/L RS504393 or a combination of both for 72 hours. Significance was calculated using the two-way ANOVA. The data are representative of three independent experiments. G, Immunoblot analysis of the trametinib-resistant line treated with trametinib (100 nmol/L) in combination with RS504393 across the indicated concentrations (left). Relative band densities of immunoblots (right) were measured using ImageJ, normalized to β-actin and represented relative to DMSO-only treatment control, which is shown as a dashed line. *, P ≤ 0.05; **, P ≤ 0.01; ***, P ≤ 0.001; ****, P ≤ 0.0001.

