. 2023 Oct 27;30(10):2233–2244. doi: 10.1158/1078-0432.CCR-22-3573

Figure 2.

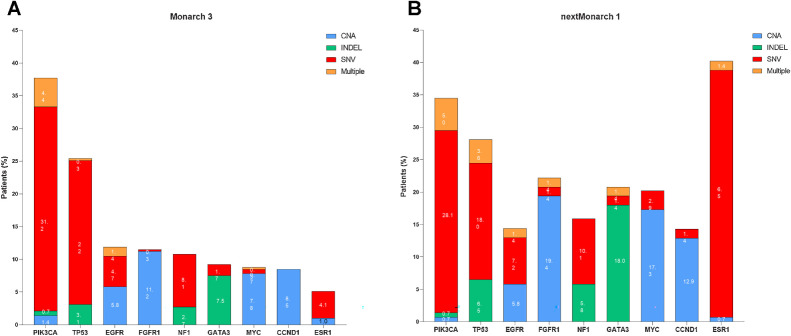
Figure 2. Frequency of gene alterations at baseline. Bar graphs representing frequency of gene alterations at baseline by gene and type of alteration in MONARCH 3 (A; n = 295, TR population) and nextMONARCH (B; n = 139, TR population). CNA, copy-number alterations; INDEL, insertions/deletions; SNV, single-nucleotide variant; TR, translational research.

Frequency of gene alterations at baseline. Bar graphs representing frequency of gene alterations at baseline by gene and type of alteration in MONARCH 3 (A; n = 295, TR population) and nextMONARCH (B; n = 139, TR population). CNA, copy-number alterations; INDEL, insertions/deletions; SNV, single-nucleotide variant; TR, translational research.