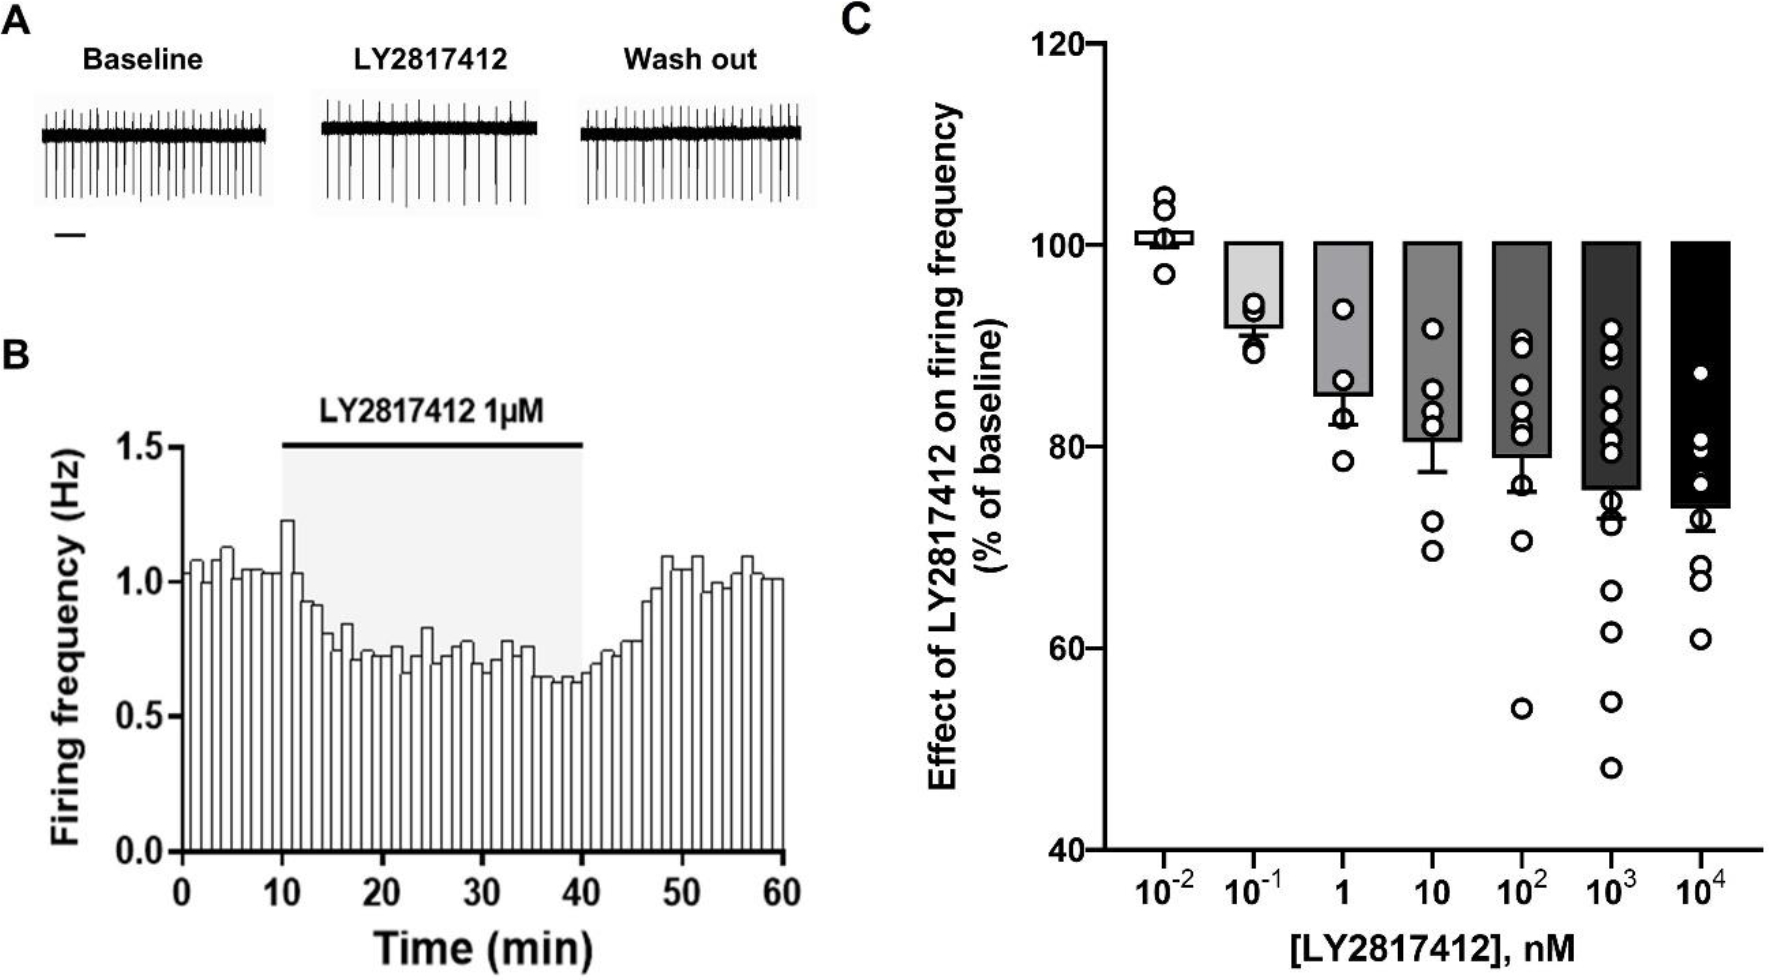
Figure 1. LY2817412 decreases the spontaneous VTA DA firing activity.

(A) Representative traces of spontaneous firing activity recorded in cell-attached configuration from a putative VTA DA neuron before (Baseline), during (LY2817412 1 μM), and after (Wash out) LY2817412 slice perfusion. Scale bar: 2 s. (B) The bar graph shows the temporal changes of firing rate (Hz) of the same representative putative VTA DA cell before, during and after LY2817412 slice perfusion. (C) The graph reports the concentration-dependent effect of LY2817412 on putative VTA DA neuronal firing rate. Note that, except for the 10−2 nM concentration, only data from LY2817412-responding cells are reported in this graph.
