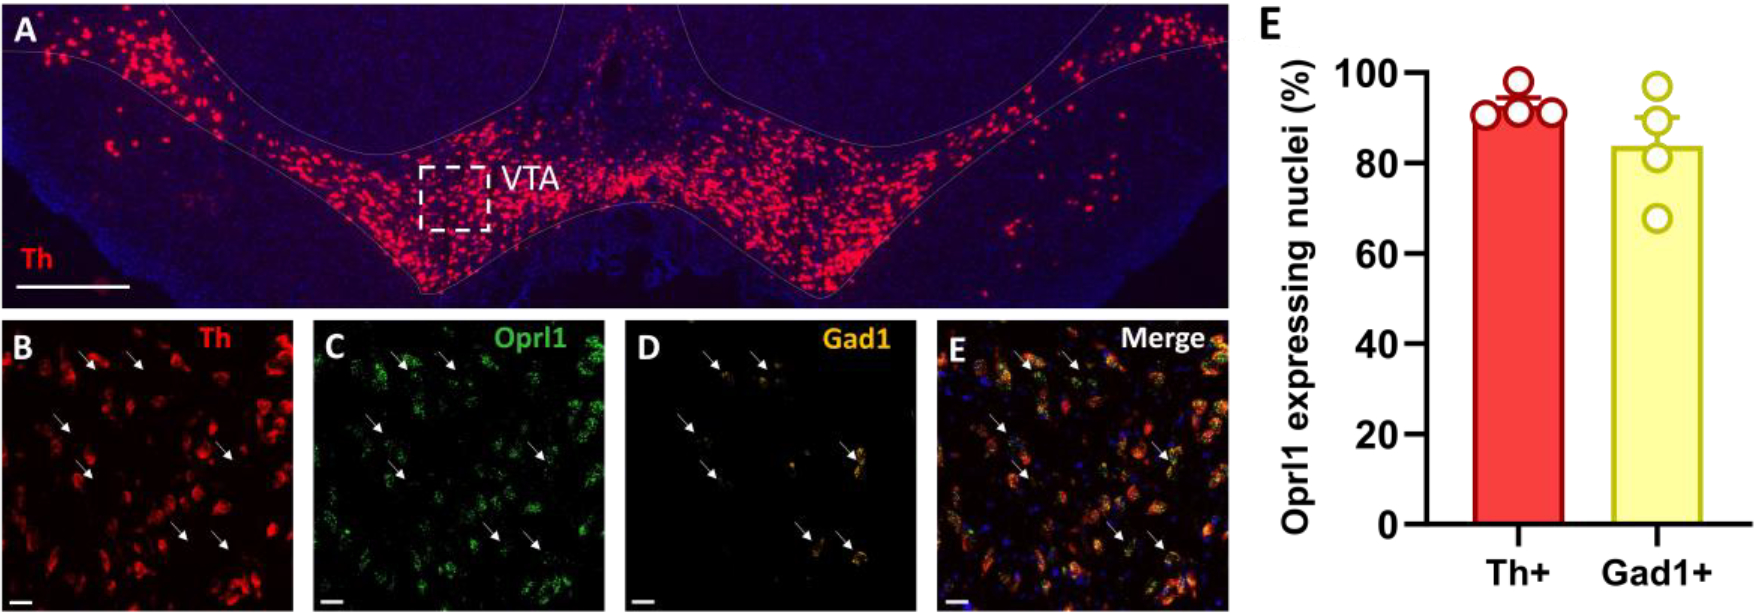
Figure 2. NOP receptors are expressed in VTA DA and GABA neurons.

(A) Representative large-scale 2x magnification image showing the expression of Th (red) and DAPI (blue) mRNA through fluorescent in situ hybridization in VTA coronal slices. Scale bar: 500 μm. (B-E) Representative 20x magnification images from the white dashed-line box from panel A showing expression of Th (red), Oprl1 (green), Gad1 (yellow), and DAPI (blue) mRNA through fluorescent in situ hybridization in VTA coronal slices. White arrows point to the localization of Gad1-positive neurons. Scale bar: 25 μm. (F) Bar graphs represent the average percentage of Th- and Gad1-positive nuclei co-expressing Oprl1.
