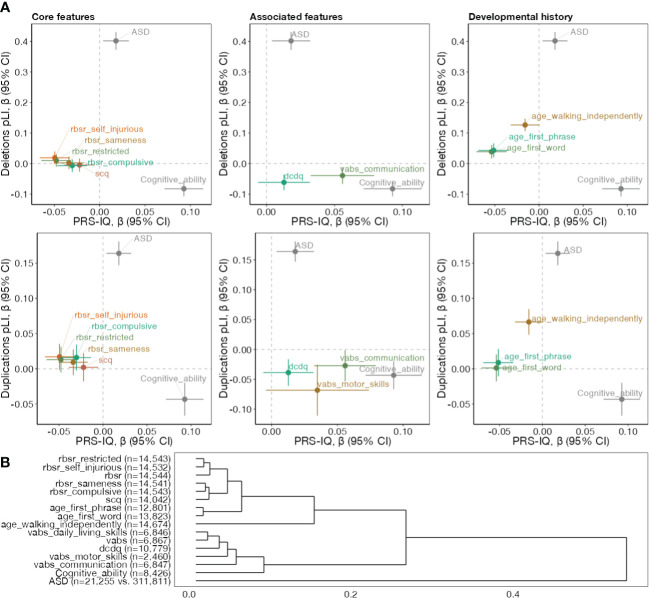
Figure 3.
Genetic dissection of phenotypes among subjects with ASD. (A) Comparing the effect directionality of PRS-IQ and deletions (upper plots), and duplications (lower plots). Effect sizes and their 95% confidence intervals on core ASD features, specifiers and associated features, and developmental history traits are displayed, along with ASD risk and cognitive ability. The burden of CNVs (deletions and duplications) and PRS-IQ only have convergent effects on ASD risk. (B) Hierarchical clustering of phenotypes based on their association effect sizes with PRS-IQ, deletion burden and duplication burden. The number displayed reflects sample sizes. Only phenotypes with at least one significant effect (FDR<0.05) are displayed within each plot. See section "Phenotypic measures" for references to abbreviations.

