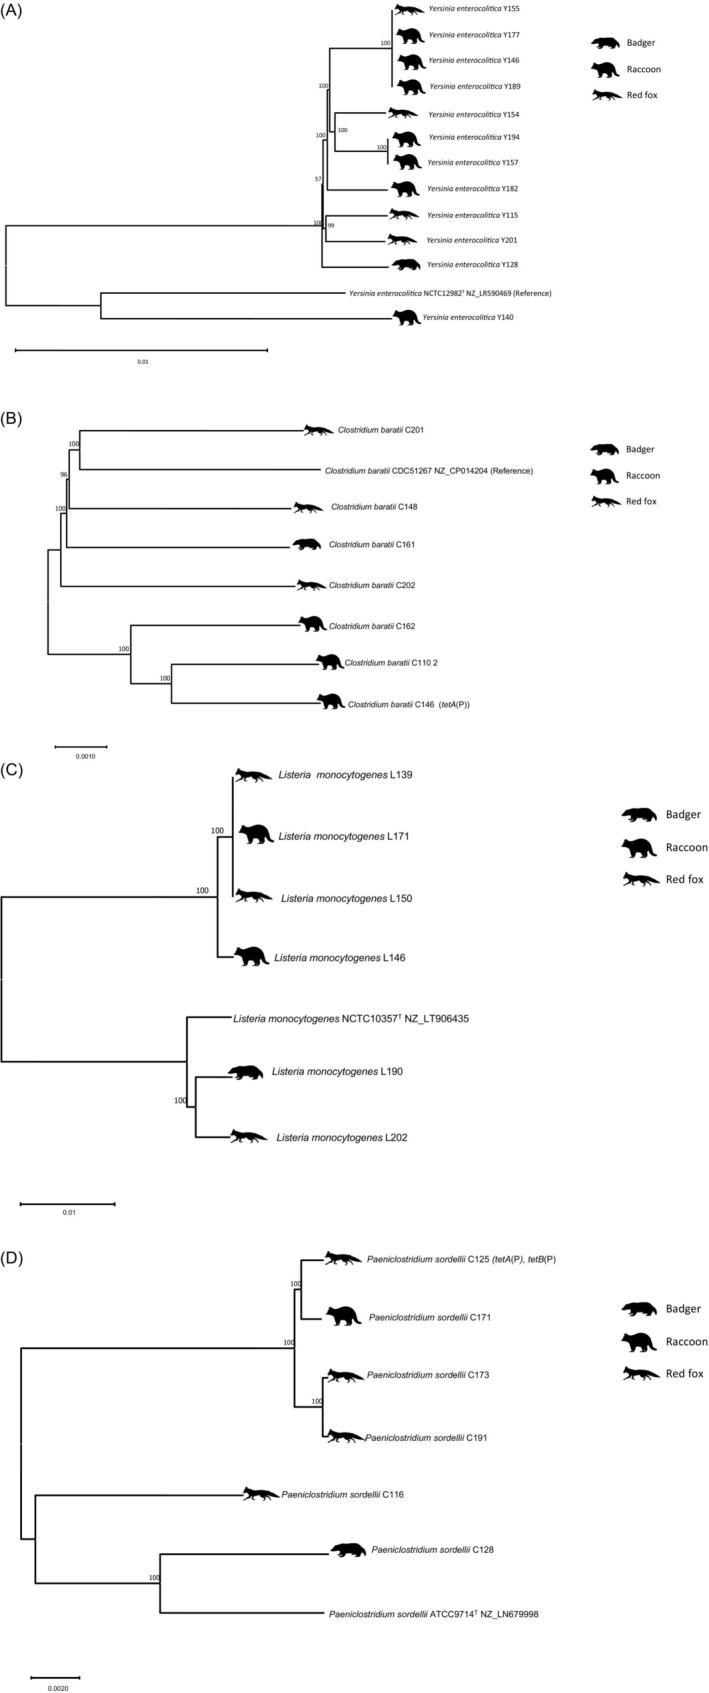
FIGURE 2.

Phylogenies of bacterial pathogens isolated. (A) Phylogeny of Yersinia enterocolitica isolates. The host species is indicated with icons. The tree is based on core genome single nucleotide polymorphisms (SNPs) determined with snippy 4.6.0. Clustering was inferred with neighbour‐joining. The percentage of replicate trees in which the associated taxa clustered together in the bootstrap test (100 replicates) is shown above the branches. The evolutionary distances were computed using the Maximum Composite Likelihood method and are in the units of the number of base substitutions per site. The rate variation among sites was modelled with a gamma distribution (shape parameter = 1). There were a total of 3,375,159 positions in the final dataset. Evolutionary analyses were conducted in MEGA11. (B) Phylogeny of Clostridium baratii isolates. The host species is indicated with icons. The tree is based on core genome SNPs determined with snippy 4.6.0. Clustering was inferred with neighbour‐joining. The percentage of replicate trees in which the associated taxa clustered together in the bootstrap test (100 replicates) is shown above the branches. The tree is drawn to scale, with branch lengths in the same units as those of the evolutionary distances used to infer the phylogenetic tree. The evolutionary distances were computed using the Maximum Composite Likelihood method and are in the units of the number of base substitutions per site. The rate variation among sites was modelled with a gamma distribution (shape parameter = 1). There were a total of 2,643,672 positions in the final dataset. Evolutionary analyses were conducted in MEGA11. (C) Phylogeny of Listeria monocytogenes isolates. The host species is indicated with icons. The tree is based on core genome SNPs determined with snippy 4.6.0. Clustering was inferred with neighbour‐joining. The percentage of replicate trees in which the associated taxa clustered together in the bootstrap test (100 replicates) is shown above the branches. The tree is drawn to scale, with branch lengths in the same units as those of the evolutionary distances used to infer the phylogenetic tree. The evolutionary distances were computed using the Maximum Composite Likelihood method and are in the units of the number of base substitutions per site. The rate variation among sites was modelled with a gamma distribution (shape parameter = 1). There were a total of 2,492,438 positions in the final dataset. Evolutionary analyses were conducted in MEGA11. (D) Phylogeny of Paeniclostridium sordellii isolates. The tree is based on core genome SNPs determined with snippy 4.6.0. Clustering was inferred with neighbour‐joining. The optimal tree is shown. The percentage of replicate trees in which the associated taxa clustered together in the bootstrap test (100 replicates) is shown above the branches. The tree is drawn to scale, with branch lengths in the same units as those of the evolutionary distances used to infer the phylogenetic tree. The evolutionary distances were computed using the Maximum Composite Likelihood method and are in the units of the number of base substitutions per site. The rate variation among sites was modelled with a gamma distribution (shape parameter = 0.5). There were a total of 2,868,821 positions in the final dataset. Evolutionary analyses were conducted in MEGA11.
