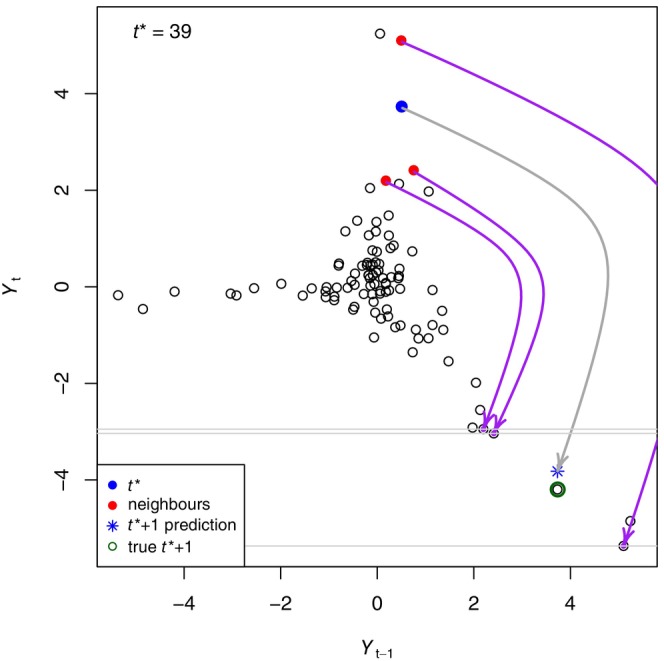
FIGURE 2.

For the example time series, embedding dimension yields the phase plane of against as in Figure 1d. Given focal time (blue circle indicating and ) we want to predict . The three nearest neighbours to the blue circle in the phase plane are shown by the red circles. These are at times 11, 43 and 98, though the times cannot be inferred from the phase plane. The purple arrows show where these points move to in the phase plane one time step later, namely to the points corresponding to times 12, 44 and 99. A weighted average of and (grey horizontal lines) then gives the estimate of (blue star). In this case it is close to the known true value of (green circle). An annotated animation of this figure is shown in Figure A.2: Appendix S1, and the figures for all valid values are shown in Figure A.3: Appendix S1.
