
FIGURE 3.
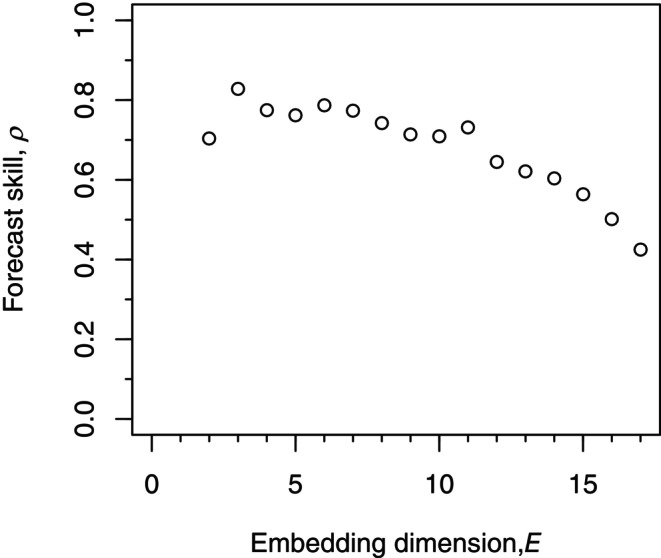
Dependence of the Pearson correlation coefficient, , on embedding dimension, , for the example time series from Figure 1. The best fitting model is given by the highest , and corresponds to which is what would be used to forecast . We have shown high enough values of to show a clear decline in , but in general the maximum considered should be about (Munch et al., 2020), which is 10 here.