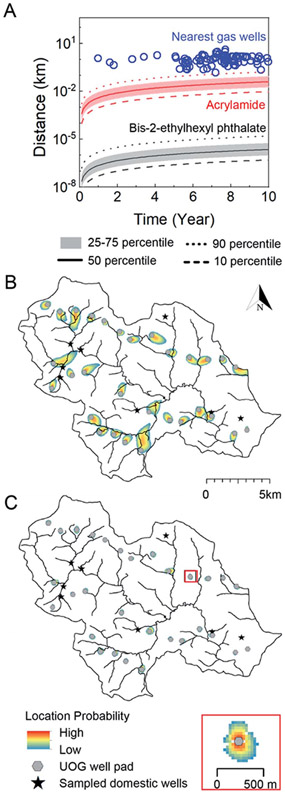
Fig. 5.
Contaminant transport length-scales are short relative to the distance to nearest oil and gas well over the timescale of unconventional oil and gas well development in Northeastern PA. (A) Gas well drilling age and distance to nearest groundwater well (blue circles) are shown alongside transport distance as a function of time considering a distribution of hydrological conditions in southeastern sub-region of Bradford county, PA and two representative end-members: acrylamide (red, ) and bis-2-ethylhexyl phthalate (black/gray, , where is in ). The solid, dashed, dotted, and shaded regions refer groundwater transport velocities that bound the distribution of the results. B (acrylamide) and C (bis-2-ethylhexyl phthalate) illustrate geospatially specific transport distances about 30 gas well pads (gray circles) near 8 groundwater wells (black stars) in southeastern Bradford County after 10 years. The heat maps in B and C delineate the location probability of acrylamide and bis-2-ethylhexyl phthalate ten years after a pulse-type injection from each gas well. The low probability is always set as 10−7, and high probability is a function of the size of the plume and is defined as 1−0.8 (0.16) in B, and 10−0.004 (0.99) in C. The inset shows a scaled site for viewing. The area of gas wells is not proportional to the map scale. The evolution of the transport zones over 1, 5, and 25 year time frames are available in the ESI (Fig. S11†).

