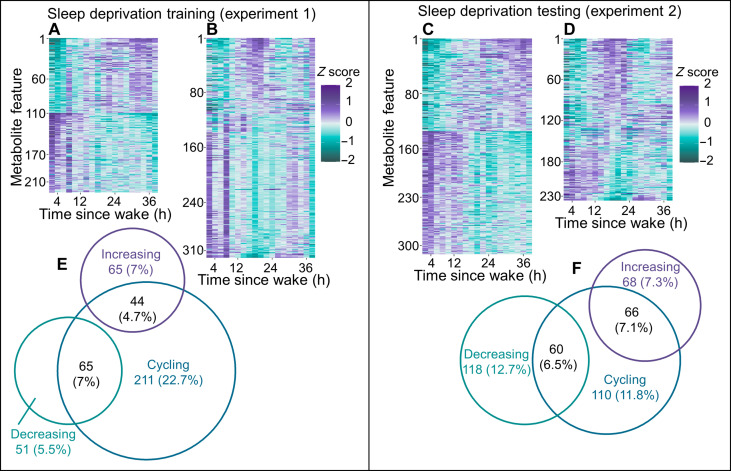
Fig. 1. Features isolated by HILIC LC-MS and showing linear and/or cyclical trends across each sleep deprivation experiment.
Heatmaps display significant (FDR-adjusted P value of <0.05) group-level trends during sleep deprivation for linear (A) and cycling (B) trends for experiment 1 (n = 12) and linear (D) and cycling (E) trends for experiment 2 (n = 11). For all heatmaps, purple corresponds to the highest and green corresponds to the lowest values for z-scored median-normalized peak area. Venn diagrams display the number and overlap of cycling, increasing or decreasing features for experiment 1 (C) and experiment 2 (F). The Venn ring sizes correspond to the number of features, and percentages are relative to the total number of features analyzed (929).

