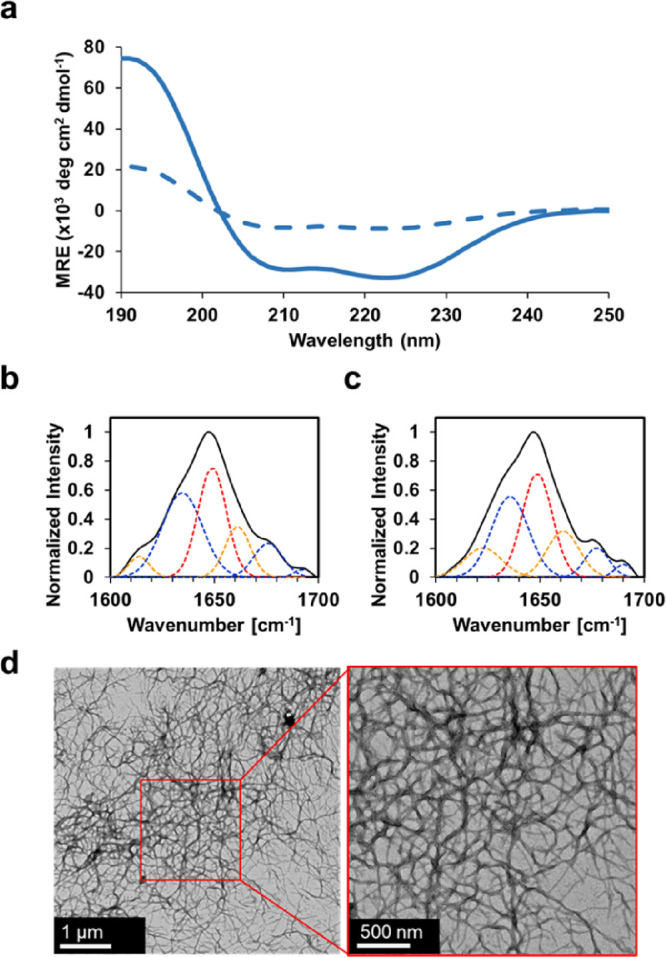
Figure 2.

(a) Circular dichroism spectra of Q8 in the solution state (solid line) and gel state (dashed line) using a wavelength scan at 4 °C. The wavelength scan represents the average of three independent trials. ATR-FTIR spectra of the amide I bond region of Q8 in the (b) solution state and (c) gel state. (d) Representative transmission electron micrographs of the Q8 hydrogel.
