Figure 1.
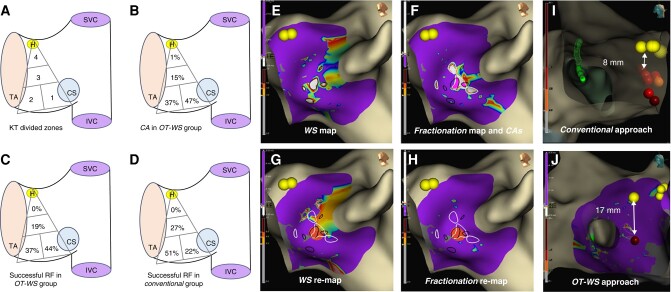
(A–H) Left lateral view of the right interatrial septum and the tricuspid valve. Panel A shows Koch’s triangle (KT), which was divided into four zones: Zones 1 and 2 were located at the base of the KT; Zone 1 at the septal isthmus, near the coronary sinus (CS) ostium and below its roof; and Zone 2 adjacent to Zone 1, towards the tricuspid annulus; Zone 3 and Zone 4 were located to the mid-septal and perihisian sites, respectively. Panels B and C display the percentage of confluent areas (CAs) and the percentage of successful RF applications in each zone, respectively, for the OT-WS group. Panel D shows the percentage of successful RF applications in each zone for the Conventional group. Panel E displays a WaveSpeed map, showing several zones with slow conduction located at KT’s base (slowest velocities in white, encircled in dark lines). Panel F shows a Fractionation Map, displaying also a few areas of fragmentation (most fragmented in white, encircled in white lines). One of these zones overlaps with two WaveSpeed slow conduction areas, delineating two small CAs (highlighted in pink colour). Panels G and H display post-ablation maps of WaveSpeed and Fractionation, respectively, showing a single (successful) RF application (dark orange dot, lesion index 4.2) in Zone 1, and the elimination of the previously encircled CAs. (I and J) Right lateral view focusing on the distance between the His signal (yellow dots) and the ablation site (red dots). A <10 mm distance is demonstrated from a patient belonging to the Conventional group (Panel I), while a much safer distance is noted from a patient belonging to the OT-WS group (Panel J). IVC, inferior vena cava; SVC, superior vena cava; H, His; TA, tricuspid annulus; CS, coronary sinus.

