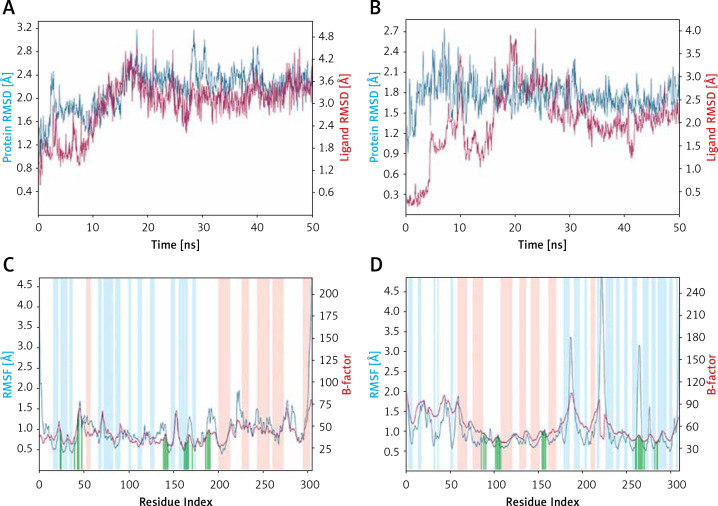
Figure 3.
Molecular dynamics (MD) simulation analysis. A – Root mean square deviation (RMSD) of Mpro alone and in the presence of proanthocyanidin, B – RMSD of PLpro alone and in the presence of rhapontin, C – variation in root mean square fluctuation (RMSF) of Mpro in the presence of proanthocyanidin and comparison with the experimentally determined B-factor during X-ray crystallography, D – RMSF of PLpro in the presence of rhapontin and comparison with the experimentally determined B-factor during X-ray crystallography. In plots C and D, the vertical green lines shows the position of amino acid residue involved in the interaction with inhibitor. Also, light brown and teal colors indicate α-helical and β-sheet regions

