Fig. 3.
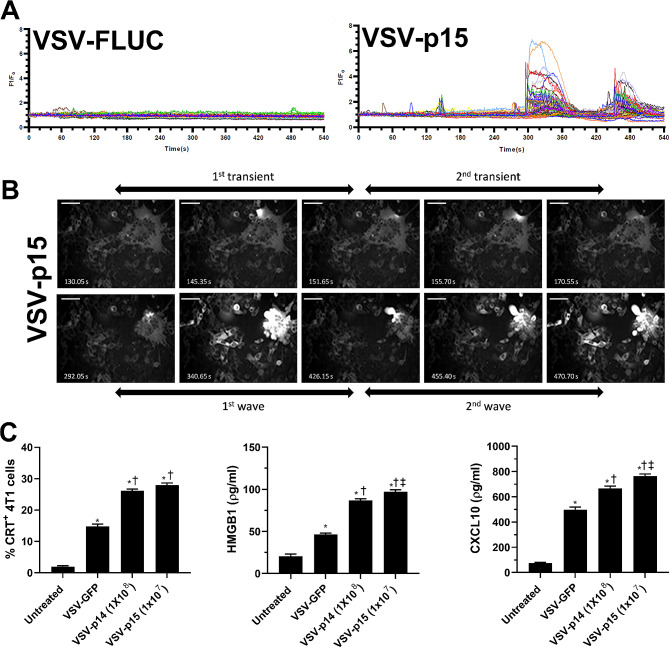
FAST proteins increase the VSV-induced markers of immunogenic cell death. Calcium flux reporter 4T1-GCaMP6s cells were infected with either VSV-fluc or VSV-p15 in vitro at an MOI of 1. (A) Single cell Ca2+ traces of 4T1-GCaMP6s cells 14 h post infection with either VSV-fluc or VSV-p15 were imaged at 2.22 Hz for 9 min. Each line represents a single cell (n = 40 per group). (B) A representative time course of Ca2+ fluxes in 4T1-GCaMP6s cells during syncytial death 14 h post VSV-p15 infection. Scale bar is 50µM. (C) Tumors and blood from untreated and treated tumor-bearing mice were harvested 24 h after final VSV treatment as performed in Fig. 2A. Tumors were isolated and dispersed into single cell suspensions. Flow cytometry was used to assess surface expression of calreticulin (CRT) (n = 8-9per group). HMGB1 and CXCL10 concentrations were determined in blood serum by ELISA (n = 3-9per group). *p < 0.05 compared to untreated, †p < 0.05 compared to VSV-GFP, ‡p < 0.05 compared to VSV-p14

