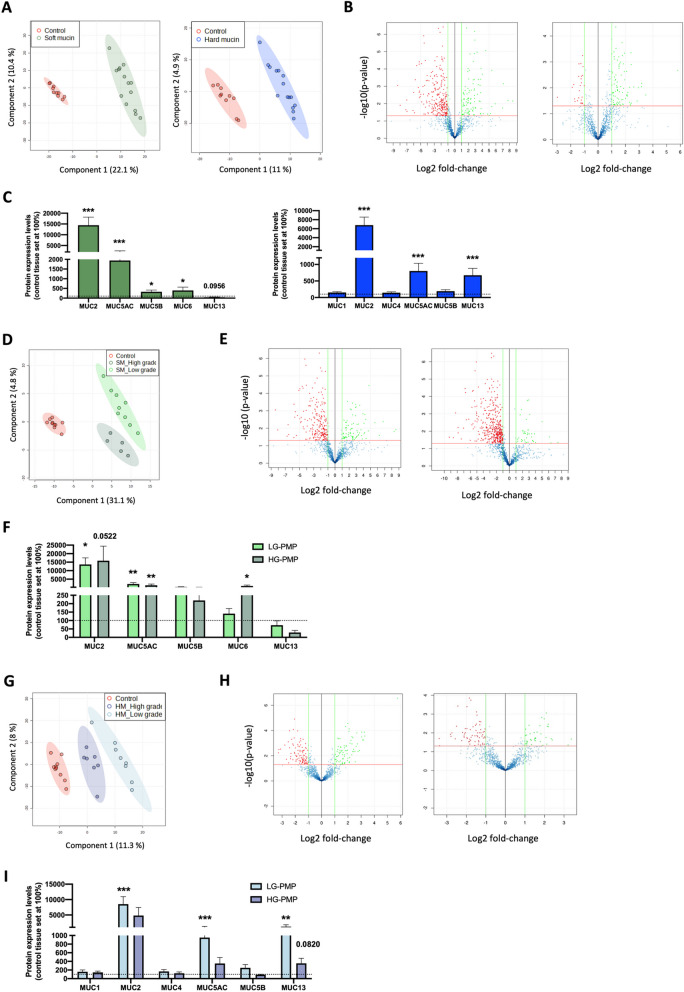
Fig. 2.
Proteomic analysis of soft and hard mucin obtained from LG-PMP and HG-PMP samples compared to control samples. A Partial least squares discriminant analysis (PLS-DA) of the proteome profile between soft (left; n = 14) and hard (right; n = 15) mucin samples and control tissues (n = 10). B Volcano plots showing Log2 Fold Change expression vs –log10 (p-value) of differentially expressed proteins with a p-value < 0.05 and an absolute Log2 Fold Change > 1 in the same sample set. Green colour indicates up-regulated proteins and red colour indicates down-regulated proteins. C Protein expression levels of mucin isoforms identified in soft mucin (green bars) and hard mucin (blue bars) mucin samples from PMP compared to control tissue (set to 100%; dashed line). D, G PLS-DA analysis of the proteome profile of low and high-grade soft mucin (SM) (D) and hard mucin (HM) (G) samples compared to control tissues. E, H Volcano plots showing Log2 Fold Change expression vs –log10 (p-value) of differentially expressed proteins with a p-value < 0.05 and an absolute Log2 Fold Change > 1 in low (left panel) and high-grade (right panel) soft mucin (E) and hard mucin (H) samples compared to control tissues. F, I Protein expression levels of identified mucin isoforms in low (light bars) and high-grade (dark bars) soft mucin (F) and hard mucin (I) samples compared to control tissue (set to 100%; dashed line). * p < 0.05 and, ** p < 0.01, *** p < 0.001

